
This article explains what the Summary tab in Run results is for in Leapwork Go.
What the Summary page is for
The Summary tab is the high-level view of a run. It gives you a quick overview of the run outcome, highlights key performance metrics, and helps you decide what to investigate next.
Use the Summary page when you want to:
-
review the overall outcome of a run without inspecting every timestamp
-
see the main performance signals in one place
-
understand whether the run behaved as expected under load
-
identify which areas may need deeper analysis in other result views
What you can see on the Summary page
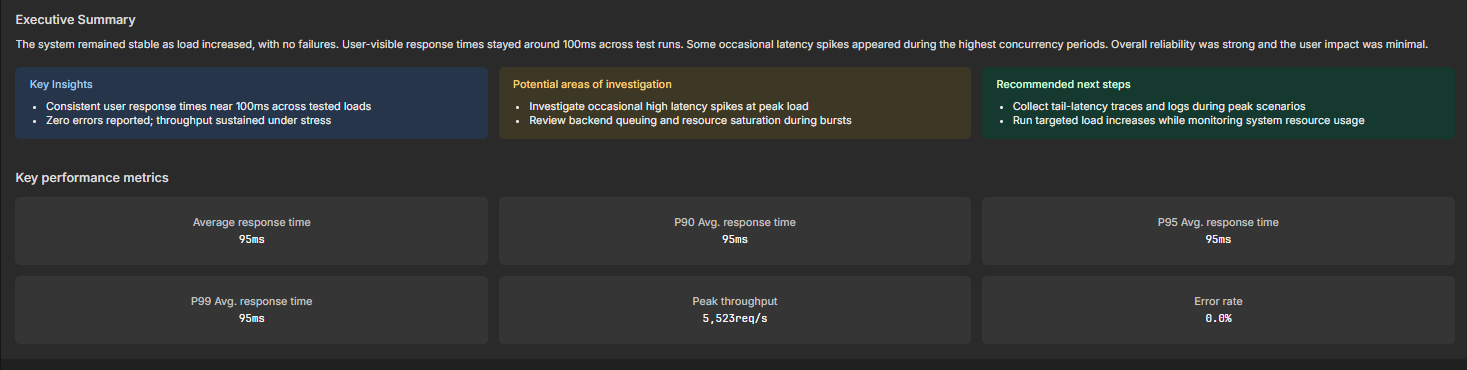
The Summary tab provides a high-level overview of the run and includes:
-
run status
-
start time
-
total duration
-
peak virtual users
-
average response time
-
throughput
-
error rate
-
peak load
-
visual summaries such as cards that help you understand the overall run outcome more quickly
-
AI-generated run interpretation for supported test types
-
aggregated sequence-level metrics
AI report detail
The AI Report detail section gives you a short written interpretation of the run.
At the top of the section, you can select the test type. The available options shown in the current UI are:
-
Go test
-
Load test
-
Soak test
-
Stress test
-
Baseline test
The AI report answers key questions about the run, including:
-
whether performance degraded with load
-
where errors increased
-
which sequence or endpoint was the bottleneck

Aggregated sequence metrics
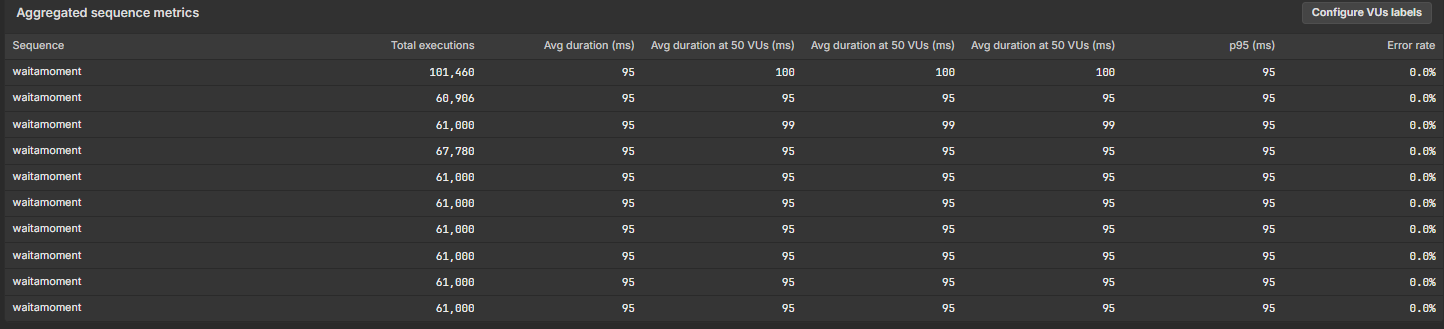
The Aggregated sequence metrics table gives you a sequence-level view of performance so you can compare how different sequences behaved during the run.
The table includes columns such as:
-
Sequence
-
Total executions
-
Avg duration (ms)
-
average duration at specific virtual-user levels
-
p95 (ms)
-
Error rate
The table also includes a Configure VUs labels option so the virtual-user-specific average-duration columns can be labeled for the load levels you want to review.
Use this section when you want to:
-
identify which sequences ran most often
-
compare average and p95 duration across sequences
-
check whether a specific sequence becomes slower at higher virtual-user levels
-
confirm whether errors are concentrated in a particular sequence
When to use Summary instead of other result views
Use Summary when you want the clearest overall picture of a single run.
Use Detailed view when you need to inspect how the system behaved at a specific point in time during the run.
Use Trend analysis when you want to compare comparable runs over time and understand whether performance is improving, stable, or regressing.
Typical workflow
-
Open Results for the run you want to review.
-
Open the Summary tab.
-
Review the top-level run context and KPI values.
-
Read the AI Report detail section for a quick interpretation of the result.
-
Review Aggregated sequence metrics to see which sequences contributed most to duration or errors.
-
Use the Summary page to decide whether you need deeper investigation in Detailed view or Trend analysis.
Child and sub-sequence grouping in snapshot metrics
The Overall Snapshot Metrics section now displays child and sub-sequence metrics using a hierarchical structure that reflects the organization of the executed sequence.
This makes it easier to understand how individual child sequences contribute to overall execution performance while preserving visibility into detailed step-level metrics. You can switch between two presentation modes.
Groups
Groups displays metrics using expandable parent-child relationships. Child sequences appear as grouped sections that can be expanded to reveal individual steps and their associated statistics.
Use this view when you want to understand how performance is distributed across the sequence hierarchy.
Steps
Steps displays a flat list of all recorded steps without grouping. Use this view when you want to compare individual steps regardless of their location within the sequence structure.
Scope filters
The Summary page also includes scope filters that help focus the displayed metrics. All Steps displays metrics for every step type. HTTP Groups limits the view to HTTP activity grouped by sequence structure.
These filters replace the previous HTTP-only toggle and provide more flexible ways to explore execution data.