
This article explains what the Summary tab in Run results is for in Leapwork Performance.
What the Summary page is for
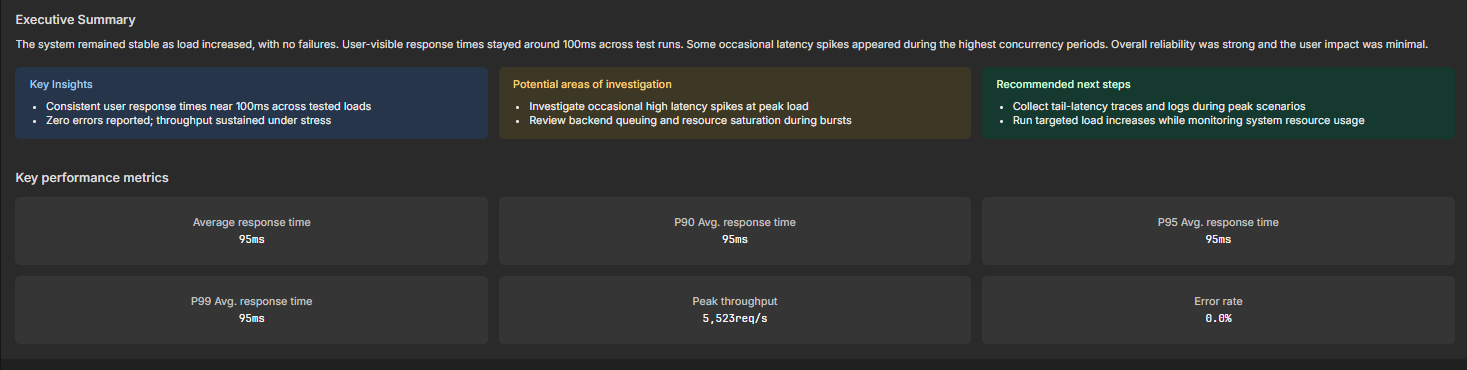
The Summary tab is the high-level view of a run. It gives you a quick overview of the run outcome, highlights key performance metrics, and helps you decide what to investigate next.
Use the Summary page when you want to:
-
review the overall outcome of a run without inspecting every timestamp
-
see the main performance signals in one place
-
understand whether the run behaved as expected under load
-
identify which areas may need deeper analysis in other result views
What you can see on the Summary page
The Summary tab provides a high-level overview of the run and includes:
-
run status
-
start time
-
total duration
-
peak virtual users
-
average response time
-
throughput
-
error rate
-
peak load
-
visual summaries such as cards that help you understand the overall run outcome more quickly
-
AI-generated run interpretation for supported test types
-
aggregated sequence-level metrics
AI report detail
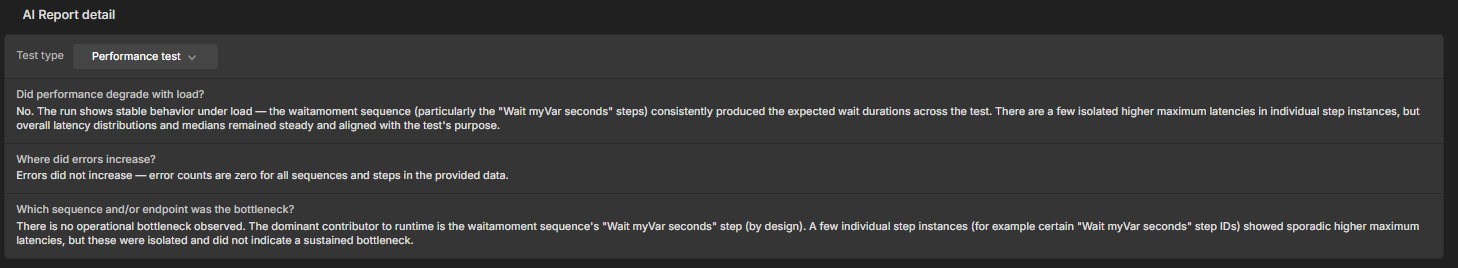
The AI Report detail section gives you a short written interpretation of the run.
At the top of the section, you can select the test type. The available options shown in the current UI are:
-
Performance test
-
Load test
-
Soak test
-
Stress test
-
Baseline test
The AI report answers key questions about the run, including:
-
whether performance degraded with load
-
where errors increased
-
which sequence or endpoint was the bottleneck
Aggregated sequence metrics
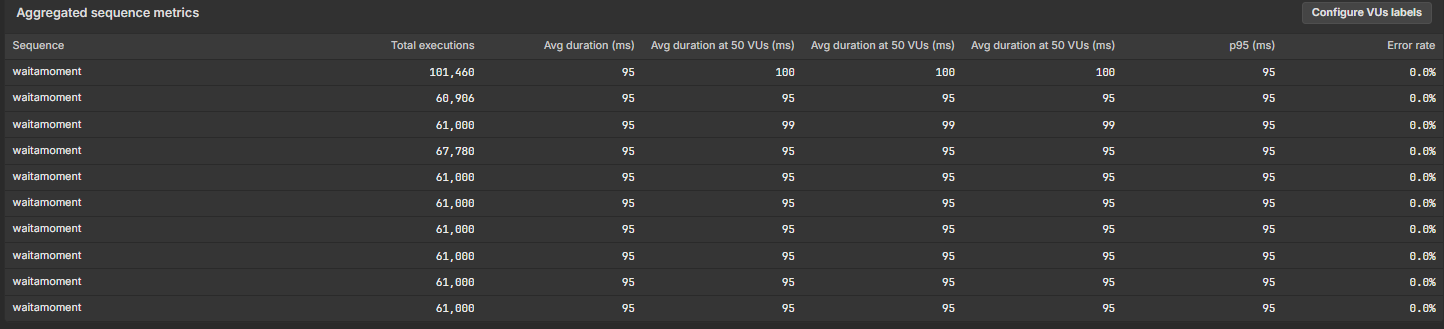
The Aggregated sequence metrics table gives you a sequence-level view of performance so you can compare how different sequences behaved during the run.
The table includes columns such as:
-
Sequence
-
Total executions
-
Avg duration (ms)
-
average duration at specific virtual-user levels
-
p95 (ms)
-
Error rate
The table also includes a Configure VUs labels option so the virtual-user-specific average-duration columns can be labeled for the load levels you want to review.
Use this section when you want to:
-
identify which sequences ran most often
-
compare average and p95 duration across sequences
-
check whether a specific sequence becomes slower at higher virtual-user levels
-
confirm whether errors are concentrated in a particular sequence
When to use Summary instead of other result views
Use Summary when you want the clearest overall picture of a single run.
Use Detailed view when you need to inspect how the system behaved at a specific point in time during the run.
Use Trend analysis when you want to compare comparable runs over time and understand whether performance is improving, stable, or regressing.
Typical workflow
-
Open Results for the run you want to review.
-
Open the Summary tab.
-
Review the top-level run context and KPI values.
-
Read the AI Report detail section for a quick interpretation of the result.
-
Review Aggregated sequence metrics to see which sequences contributed most to duration or errors.
-
Use the Summary page to decide whether you need deeper investigation in Detailed view or Trend analysis.