
Leapwork Performance is the new way to do load, performance, and API testing; fast, visual, and built for professional QA teams.
Performance lets teams simulate massive, real-world traffic to ensure applications perform flawlessly under pressure, without the complexity of traditional tools. It can record HTTP(S) network traffic against any type of backend application (such as a web server) and then parameterize and replay that traffic at large scale, while measuring response times.
With Performance you can:
-
Record and run load tests in minutes: no scripting or infrastructure setup required.
-
Orchestrate visually: design complex, multi-system load profiles like editing a movie timeline.
-
Test from anywhere: generate traffic from 20+ global regions and monitor real user experience with built-in AppDex scoring.
-
Go continuous: integrate performance testing into every sprint and CI/CD pipeline.
-
Reuse what you already have: turn your Leapwork Studio tests into scalable performance and API tests instantly.
Performance is cloud-hosted, secure, and enterprise-ready, supporting Azure AD authentication, multi-region execution, and AI-driven insights that surface performance issues before they impact your users.
In short, Performance turns performance testing from a once-a-year chore into a daily confidence booster. It helps you release faster, safer, and with data-backed certainty that your digital experience performs at its best.
Getting started video
Watch this short onboarding video for a quick walkthrough of Leapwork Performance.
It shows you how to navigate the workspace, work with Sequences and Timelines,
and run your first performance test end‑to‑end.
Core components in Performance
Performance has 4 core components that you will see referenced repeatedly in the documentation
-
Sequence: The recorded or manually created test flows that define user or system actions.
-
Timeline: The orchestration layer where sequences are combined, scaled, and executed under defined loads.
-
Data Item: Structured data sources that parameterize tests, such as AD users, CSV tables, or generated data.
-
Run Result: Real-time and post-run metrics visualizing performance, throughput, and user experience quality.
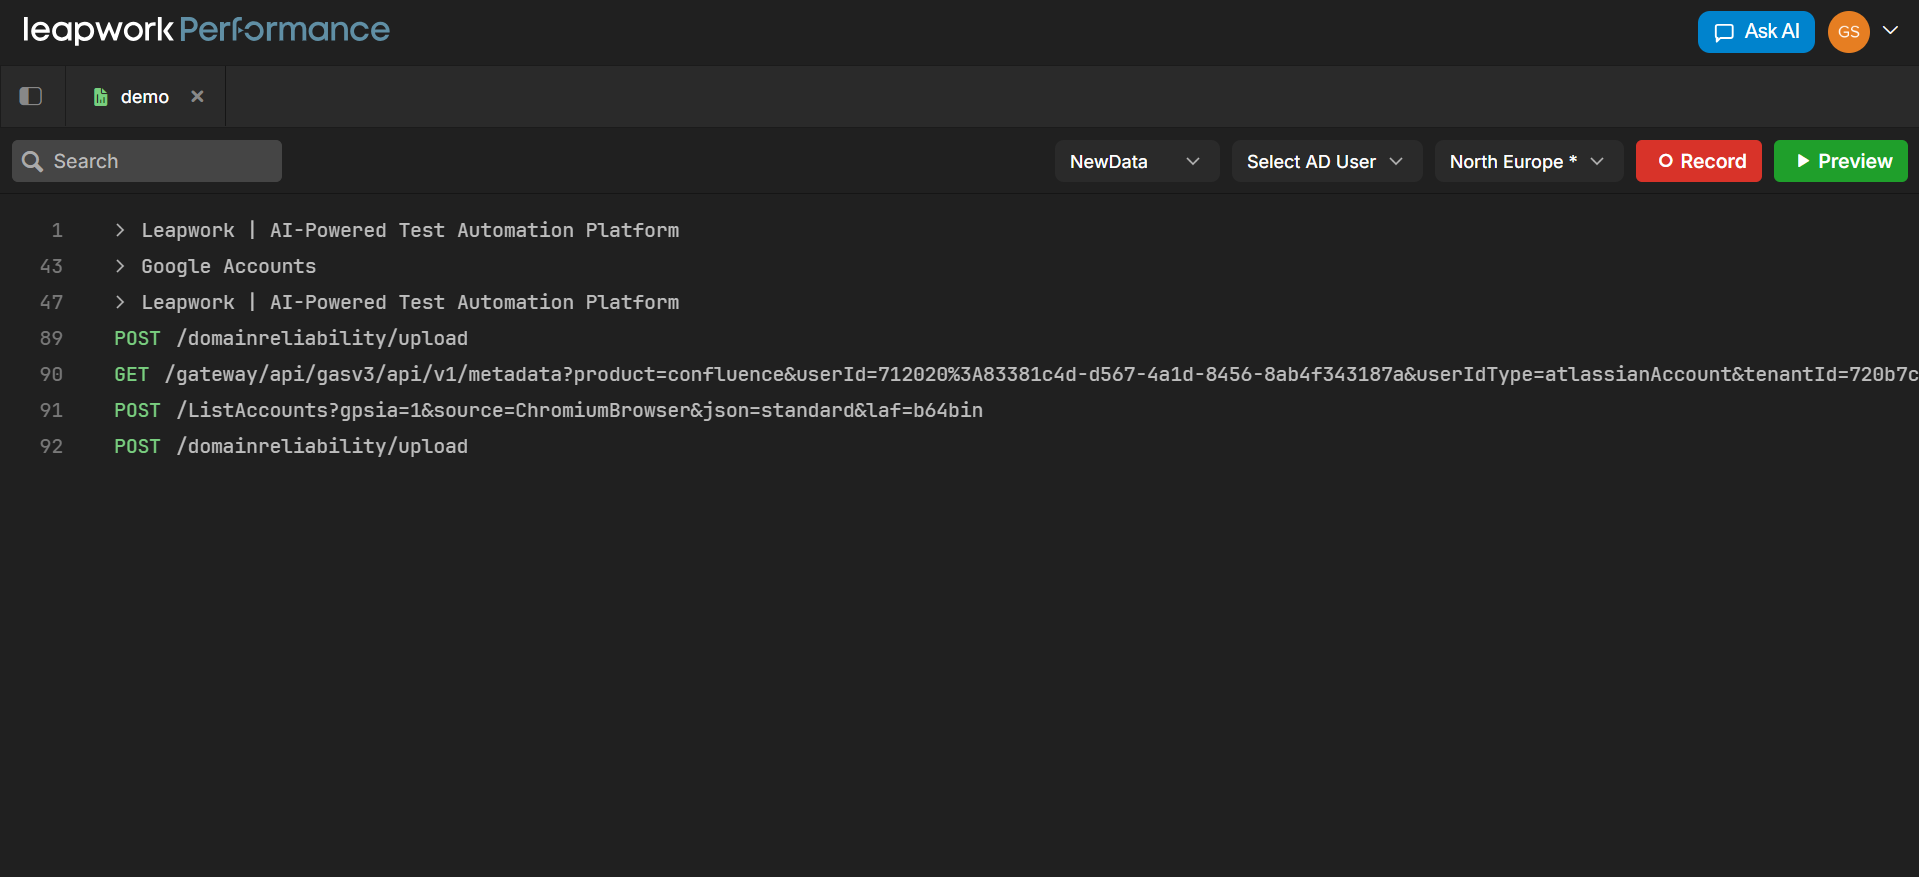
When you open Performance, you arrive at the start interface.
What’s available in the global toolbar
Along the top, you will see a global toolbar. This remains visible as you navigate through projects.
-
Your avatar: At the far right of the toolbar is your avatar menu. Clicking it opens quick access to help resources, certificate download, and sign-out.
-
Search: On the far left of the toolbar is the search field. This lets you quickly find sequences, timelines, folders, or any named item inside your workspace. The search behaves globally, so it is the fastest way to jump between assets without navigating through folders manually.
-
Collapse/Expand File Explorer: Next to the search bar is a small button that hides or shows the file explorer. This is useful when you want more horizontal space while working inside a timeline or inspecting a sequence. When hidden, Performance focuses fully on the active work area.
Overview of the Performance workspace
Use it before you start working with core concepts like Sequences, Timelines, Run Results and Data items, so you know what you see on screen and how the workspace is organized.
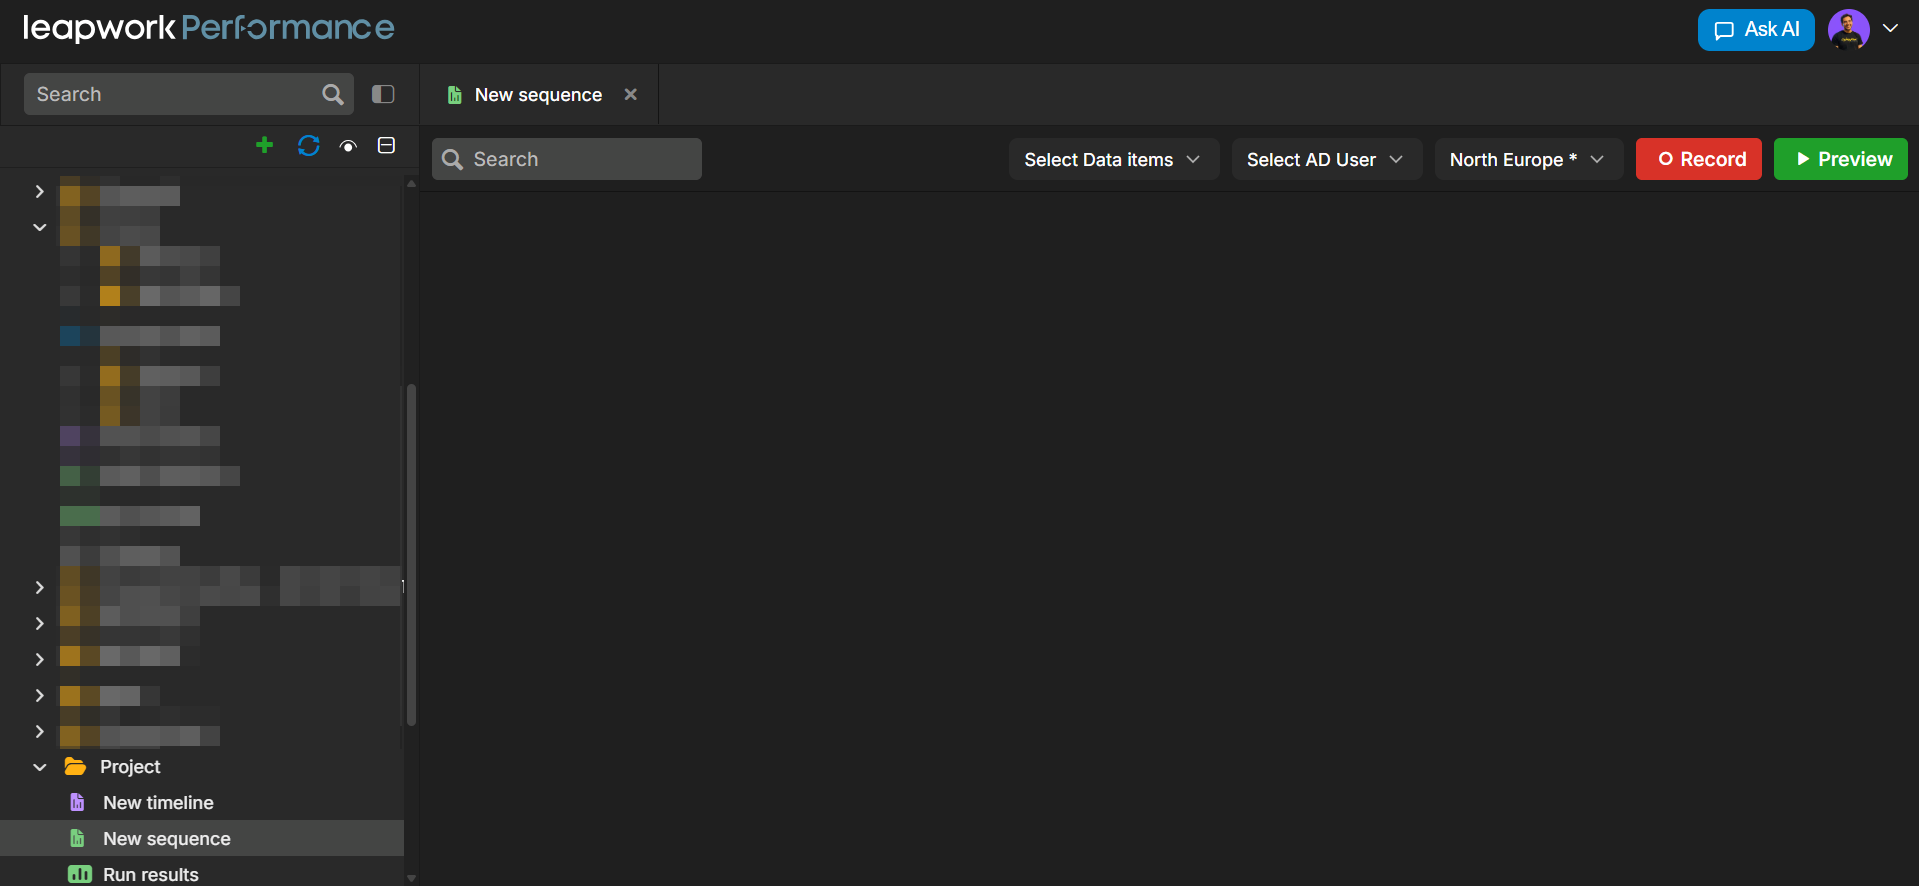
When you open any core concept (for example, a Sequence), the workspace is divided into three main areas:
-
Explorer (left panel)
-
Top bar and tabs (top)
-
Canvas and run controls (center and top-right)
The details of what you see in each area depend on the type of asset you are working with. The sections below describe the common layout that all Performance core concepts share.
Explorer
The left side of the screen shows the Explorer. Each top-level item with a folder icon is a workspace folder. Inside folders, you can store:
-
Sequences
-
Timelines
-
Data items
-
Run result
The Explorer helps you organize and manage assets in your workspace. You can search for assets, create new ones, and navigate through folders from a single panel.
Utility actions within the File Explorer panel
Inside the file explorer itself, you will find some utility actions.
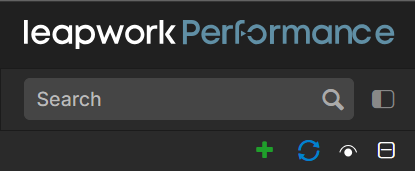
Add new item
First one is Add new item, which allows you to create 5 different things:
-
Data item will be a reusable set of values that can be used inside sequences. Data Items allow you to parameterize requests, supply test data, manage user accounts for authentication, or provide structured inputs for more advanced scenarios.
-
A Sequence is a recording of the actions you want the load, performance or API test to include against a set of endpoints in the browser or application.
-
Add a new Timeline to orchestrate load. A timeline controls how sequences run: how many virtual users are applied, how long the test lasts, and which regions the load is generated from.
-
Add a Folder to organize your work. Folders help structure Projects by grouping related sequences, timelines, and data items.
-
Create a new Project that serves as a top-level container for all test assets. Projects keep larger initiatives separated and make it easy to manage multiple test suites within the same workspace.
Collapse all
Second icon is Collapse all, which folds the entire folder structure back to its top level. This is helpful when a project contains many nested folders and you want to reset the view.
Reload
Third is Reload, which refreshes the explorer without reloading the full application. This ensures the folder tree stays in sync if new items are added, renamed, or reorganized by collaborators.
Show deleted items
The eye icon in Performance is used to toggle the visibility of deleted items.
Click it to quickly show or hide deleted runs/items without changing your filters or view settings.
These small tools make it easy to navigate large projects, keep the interface tidy, and move quickly between the parts of Performance you use most. Below these controls, the folder tree displays your workspace content. Expand or collapse folders to browse assets.
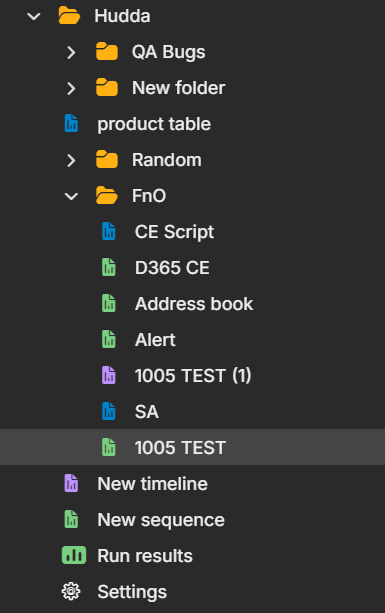
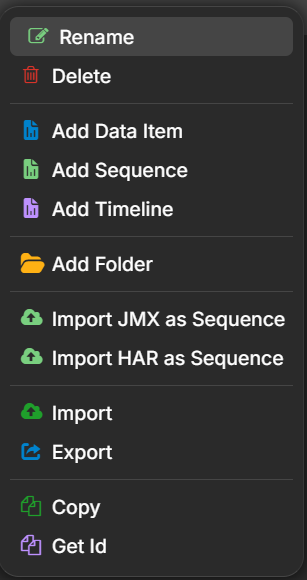
You can also right-click folders or assets to open actions such as Rename, Delete, or More. At the bottom, the current sequence node shows the selected sequence.
|
Menu Item |
What it Does |
|---|---|
|
Rename |
Changes the name of the selected item or folder. |
|
Delete |
Removes the selected item or folder. |
|
Add Data Item |
Creates a new data item under the current location. |
|
Add Sequence |
Creates a new sequence under the current location. |
|
Add Timeline |
Creates a new timeline under the current location. |
|
Add Folder |
Adds a new folder to organize items. |
|
Import JMX as Sequence |
Imports a JMX file and converts it into a sequence. |
|
Import HAR as Sequence |
Imports a HAR file and converts it into a sequence. |
|
Import |
Imports items (e.g., sequences, assets) from an external file. |
|
Export |
Exports selected items so they can be used or backed up elsewhere. |
|
Copy |
Copies the selected item so it can be pasted/duplicated. |
|
Get Id |
Shows or copies the unique ID of the selected item for reference/integration. |
Use the Project Explorer to group related sequences and data by project, team, or environment.
Top bar and tabs
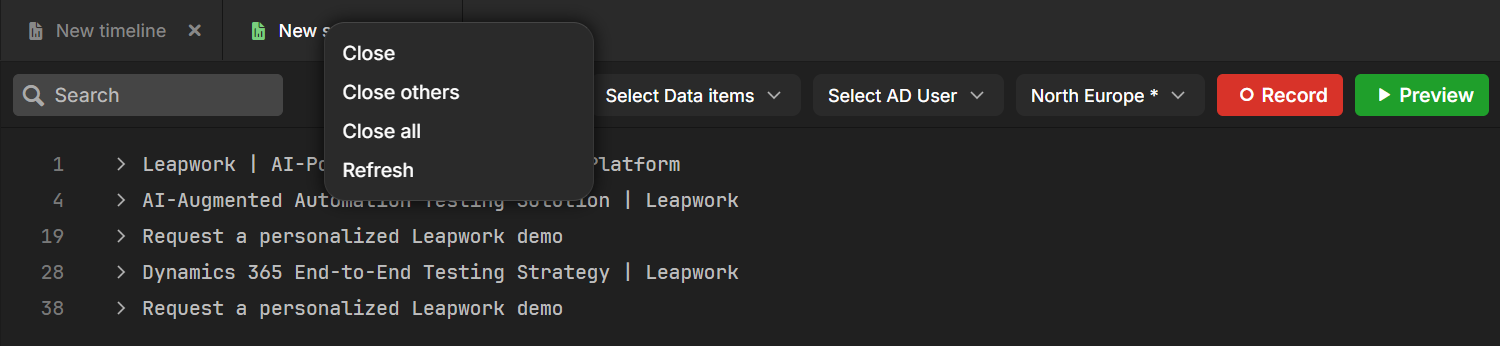
The top of the window shows the current asset and environment, as well as tabs for any other open assets.
From the tab bar, you can:
-
See which asset is currently active
-
Switch between open assets
-
Access asset-level actions such as:
-
Close
-
Close others
-
Close all
-
Refresh
-
You can usually access these actions by right-clicking a tab or by right-clicking the asset in the Explorer.
When you work with multiple assets at the same time (for example, several sequences or data items), the tab bar helps you move between them without losing context.