
This guide helps you understand and use Timeline in Leapwork Performance. It explains the main parts of the Timeline UI so you can build and run performance tests using one or more sequences.
What is a Timeline?
A timeline defines how and when sequences run under load. It controls the structure and execution of a performance test.
Use a timeline to:
-
Add tracks, where each track runs a specific sequence.
-
Configure load patterns, such as ramp-up, constant load, or ramp-down.
-
Set timing, including start time, end time, and total test duration.
-
Run the test and monitor execution in real time.
A sequence describes a single user journey or flow, while a timeline organizes multiple journeys into a performance test and controls the load. A typical workflow involves building and validating sequences using Preview, adding these sequences to a timeline, and configuring tracks and schedules. Finally, users run the timeline and review the performance results.
Overview of the timeline workspace
If you’re new to Leapwork Performance, start with the Overview of the Performance workspace for a tour of the user interface:
When you open a Timeline, the workspace shows specific information inside that same layout:
-
Project Explorer: shows where the items are stored together with related assets (data items, timelines, etc.).
-
Timeline Tab: shows the timeline name and provides actions such as Close and Refresh for it.
-
Timeline canvas and tracks: the timeline toolbar provides controls used to build and manage the timeline. Typical actions include:
-
Add track
Create a new track in the timeline canvas. A track is a horizontal lane that can contain one or more sequences. Use multiple tracks to model different user journeys or traffic types in the same test. -
Add sequence
Add a sequence to the currently selected track. When you select this option, you choose which sequence to place on the timeline and where it should start. -
Distribute heights
Adjust the visual height of tracks so they are easier to compare. This is useful when the timeline contains several tracks with different user counts. -
Zoom to fit
Adjust the horizontal zoom level so the full duration of the timeline fits within the visible canvas. Use this option after changing track durations or adding new tracks.
-
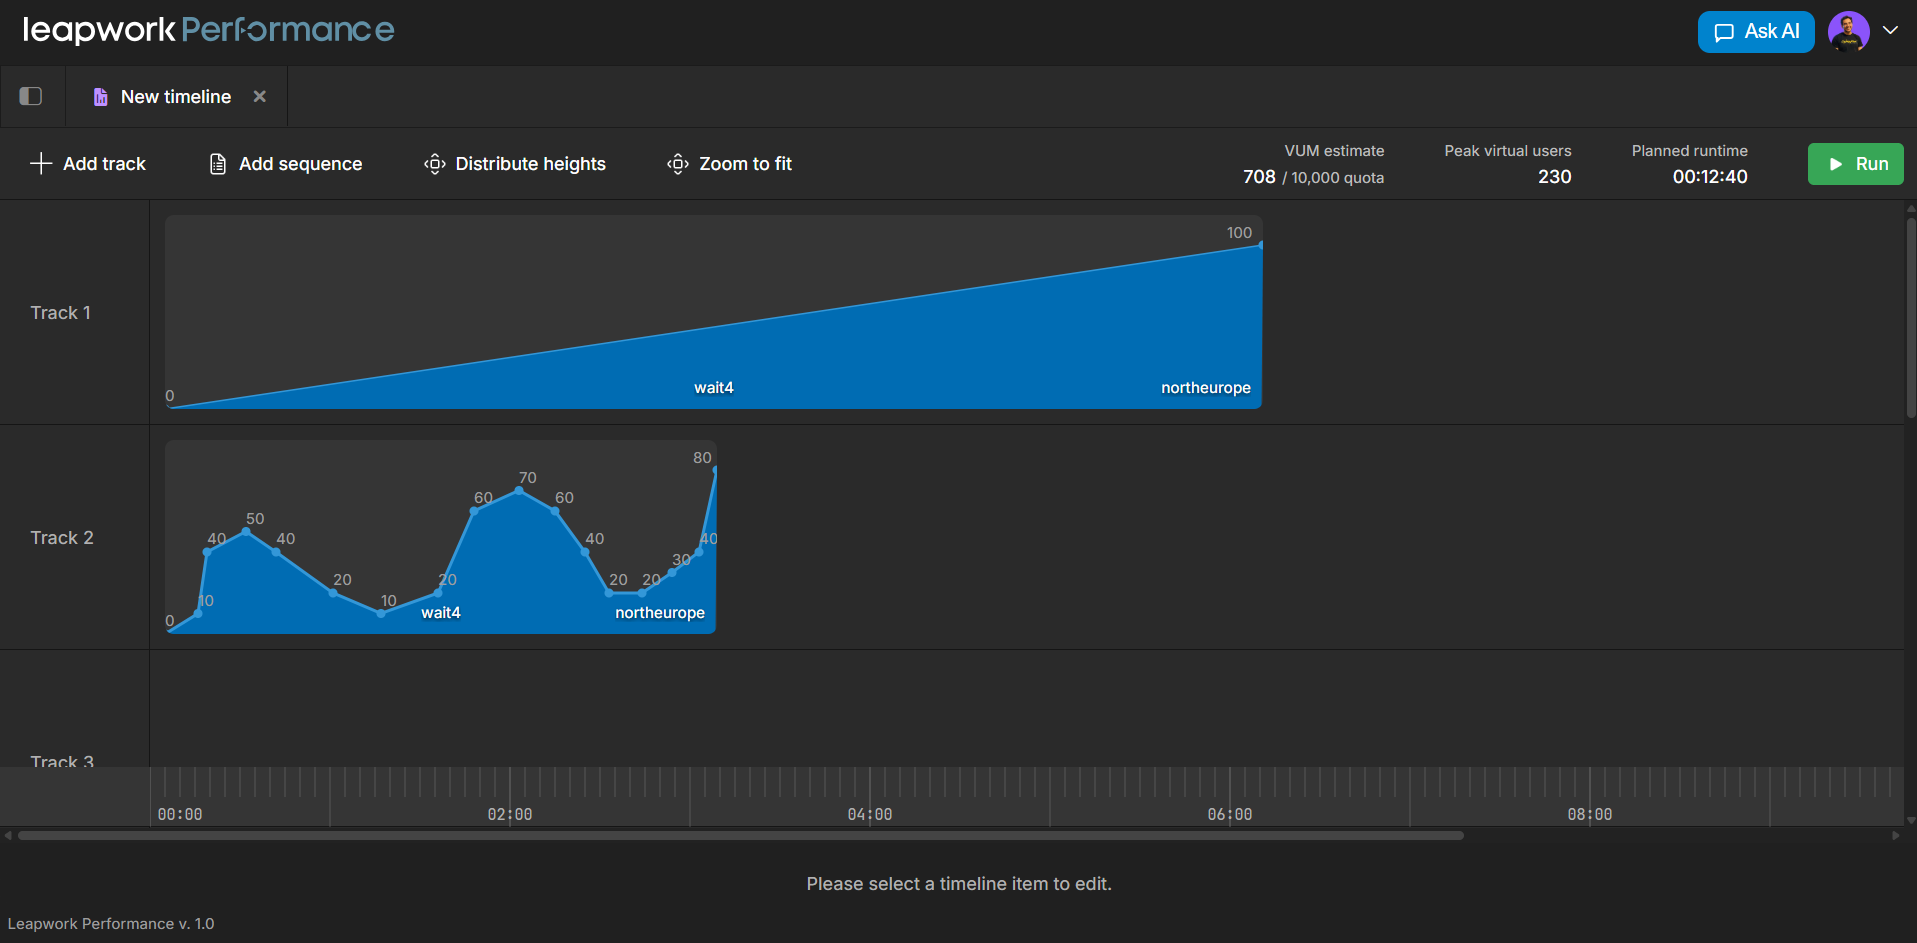
Timeline canvas and tracks
The timeline canvas in the center of the screen shows how sequences run over time. This is where you design the structure of your performance test.
Several elements help you understand and configure the test:
-
Tracks
Each track represents a lane that runs one or more sequences. You can use tracks to separate different user journeys, such as browsing versus checkout, or to run background API traffic alongside UI flows. -
Sequence blocks on the timeline
Each block represents a sequence running for a specific period of time. The shape of the block shows how the number of virtual users changes during the run. -
Time ruler
The time scale below the canvas shows the duration of the test, for example, 00:00, 02:00 and more. This helps you see when sequences start, how long they run, and how long the entire test lasts. -
Selection area
When nothing is selected, the interface displays the message Please select a timeline item to edit. When you select a track or sequence block, this area shows configuration settings such as duration, ramp pattern, and virtual user settings.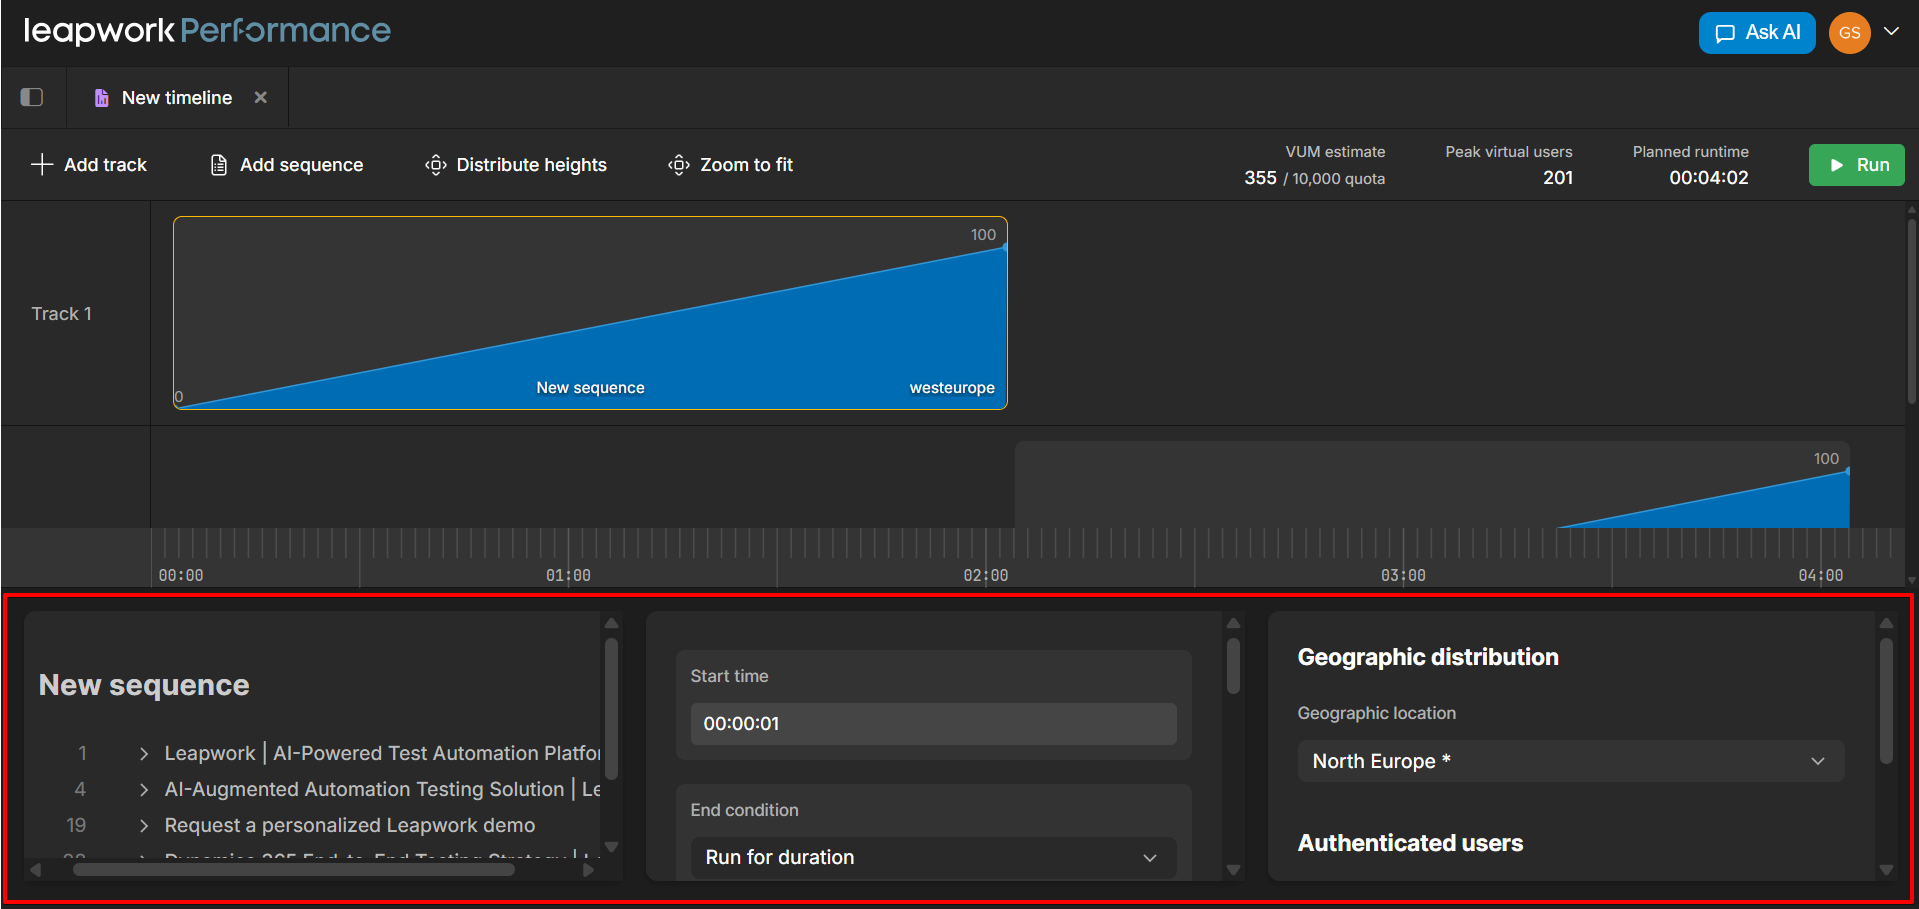
Use the timeline canvas to design how the test behaves over time. You can move or resize sequence blocks to change when sequences start and how many users run.
Run summary and main controls
The run summary appears in the top-right corner of the timeline view. It shows key information about the current test configuration before you run it.
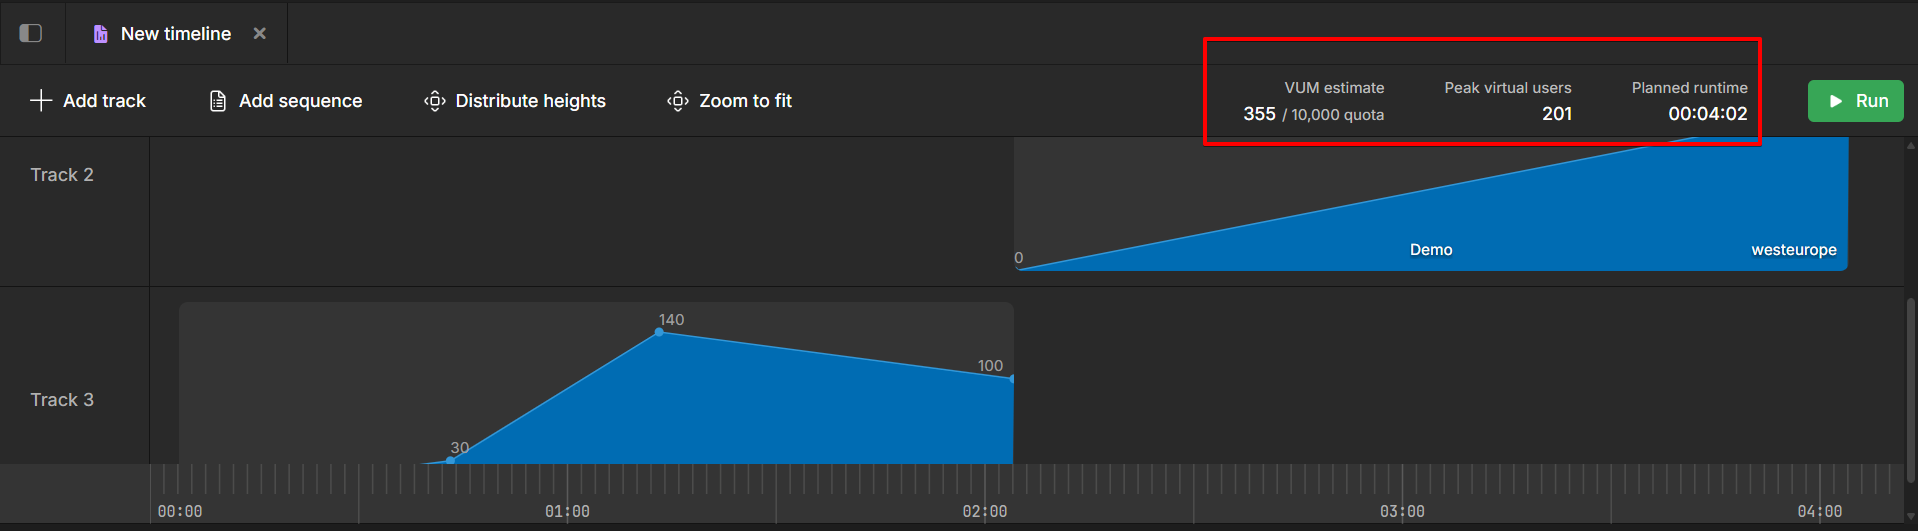
The summary includes:
-
VUM estimate
Displays the estimated Virtual User Minutes (VUM) for the timeline. For example, 36 / 10,000 quota shows how much of your quota the run will consume. -
Peak virtual users
Shows the highest number of concurrent virtual users in the timeline. -
Planned runtime
Displays the total expected duration of the test. -
Run button
Starts the timeline using the current configuration. When you select Run, Performance sends the test plan to the appropriate agents in the selected region, starts the virtual users according to the configured tracks and ramps, and collects metrics and results.
Use the run summary to confirm the expected load and duration before starting a test.