
This guide helps you get started with Sequence in Leapwork Performance, understand what you see on screen before you start building complex sequences and start recording, editing, and previewing performance tests.
What is a Sequence?
A Sequence is a list of steps that represents one user journey or API flow. In Performance, sequences are the building blocks for load tests:
-
You record or import HTTP(S) traffic to create steps.
-
You edit and parameterize those steps.
-
You reuse the same sequence across multiple timelines and load scenarios.
You typically create or open a sequence, validate it with a preview run, and then add it to a timeline to run under load.
The Sequence workspace
If you’re new to Leapwork Performance, start with the Overview of the Performance workspace for a tour of the user interface:
When you open a Sequence, the workspace shows Sequence‑specific information inside that same layout:
-
Project Explorer: shows where the sequence is stored together with related assets (data items, timelines, etc.).
-
Sequence Tab: shows the sequence name and provides actions such as Close and Refresh for that sequence.
-
Sequence Canvas: shows the sequence steps list and the step details panel, plus Record and Preview controls for this specific sequence.
Sequence tab bar and toolbar
The Sequence tab bar and toolbar at the top of the window show the current environment and the sequences you have open.

When you work with multiple sequences, the tab bar helps you switch between them quickly.
Sequence canvas
The sequence canvas appears in the large dark area at the center of the window. Use the canvas to build and edit the sequence. Here you can view the list of steps in the sequence, edit request details, add variables and assertions, control the flow, and reorder or group steps.
At the top of the canvas, several controls help you configure how the sequence works.
Data and user selection
These controls appear from left to right across the top of the canvas.
-
Search:
The sequence editor includes a search field. Use it to find steps or properties within the current sequence. -
Select Data items:
Open a picker to choose the data items that the sequence uses. Data items can include tables with test data or CSV-style lists of user accounts or payloads. After you select them, you can reference these items in step parameters and formulas. -
Select AD User:
Choose the Azure Active Directory (AD) user profile that the sequence uses for authentication. Use this option when the recorded flow requires authenticated traffic, such as Dynamics 365 endpoints. Performance uses this information to obtain tokens when it runs the sequence. -
Region selector:
Select the geographic region where Performance runs the sequence. The selected region affects network latency and behavior during preview and load execution, and determines which agents and runners perform the work. These settings control how the sequence runs, not how you edit its steps.
Run and Preview controls
On the far right of the canvas toolbar, you can start recording or run a quick test of the sequence.
-
Record:
Start the proxy. When you route HTTP(S) traffic through the recorder, Performance captures requests and responses and converts them into steps in the active sequence. Use this option to build a sequence by interacting with the target system instead of creating steps manually. -
Preview:
Run the sequence once without starting a full timeline. Use Preview to confirm that requests reach the target system and that parameterization, data items, and AD user settings work correctly. Run previews frequently while building or editing sequences before you add them to a load timeline.
Sequence steps and step details
This section introduces the sequence steps list and the step details panel. Together, these areas help you move from a recorded flow to a reusable, data-driven performance test.
The steps list provides an overview of the entire sequence, while the step details panel lets you configure how each request behaves.
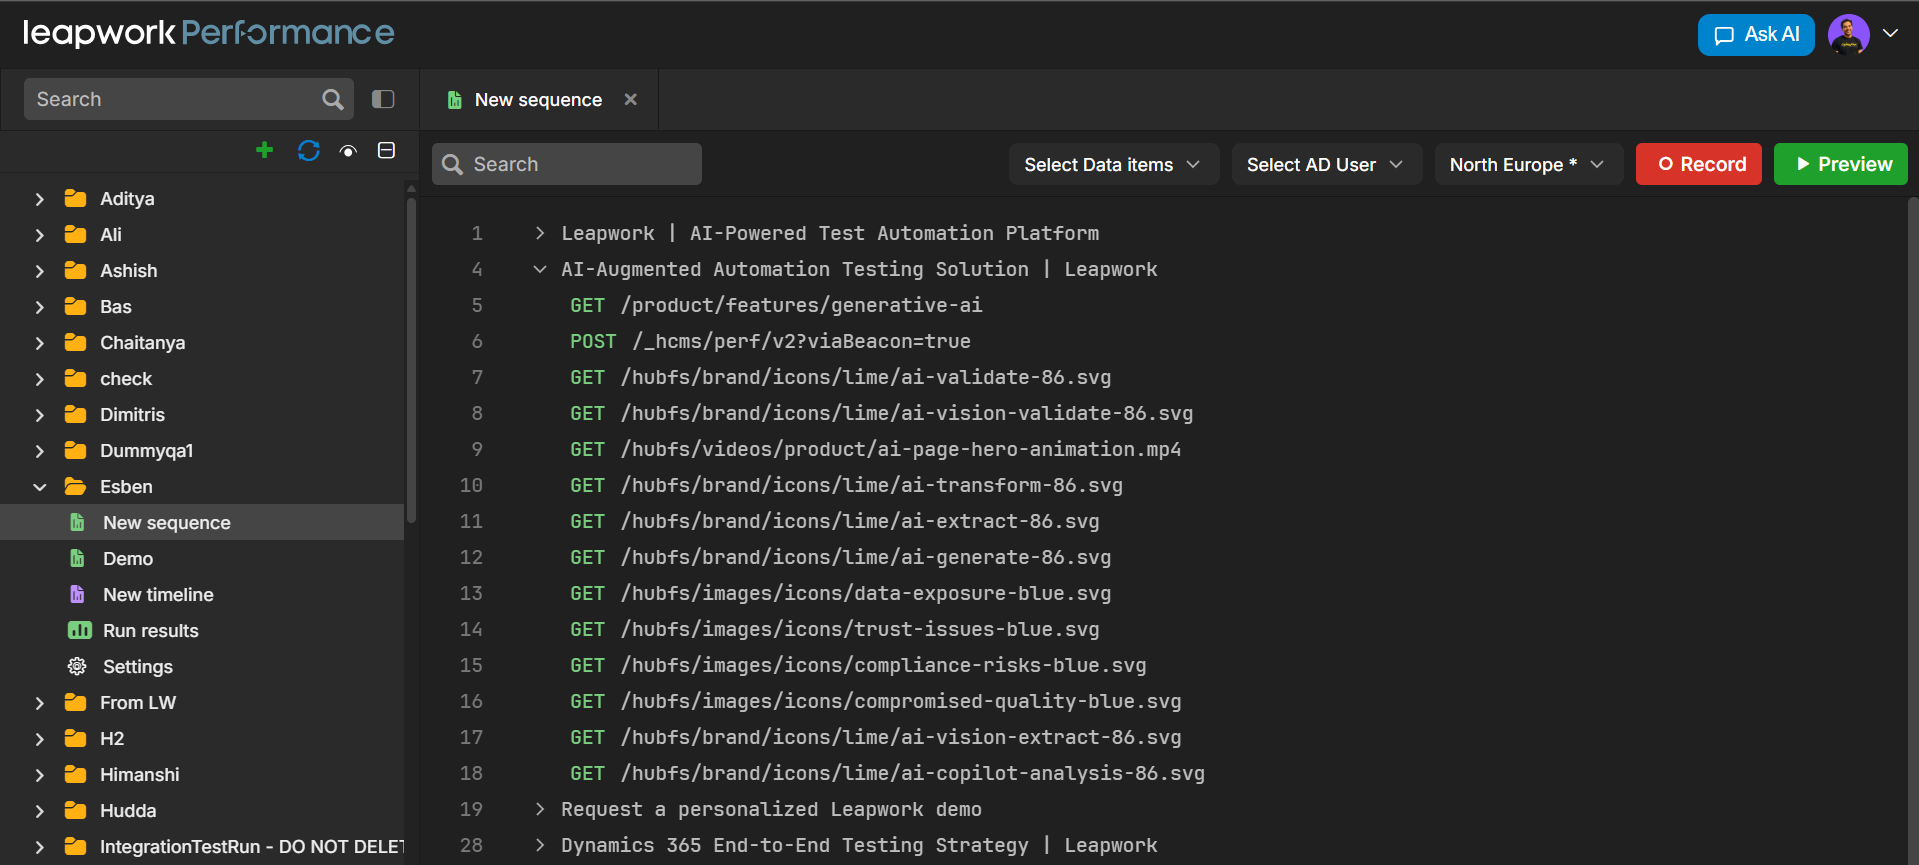
Sequence steps list
The middle section of the window displays the steps list for the selected sequence. Each row represents a step in the flow, typically an HTTP(S) request captured during recording or added manually.
The steps list gives you a quick overview of the entire sequence so you can understand how the flow will execute.
You can use the steps list to:
-
See the order of steps as Performance will execute them
-
Scan key request details, such as HTTP method, endpoint, and response status
-
Select a step to open and edit its configuration in the right-hand panel
You can also manage the flow directly from the steps list. You can right-click on steps to perform various actions:
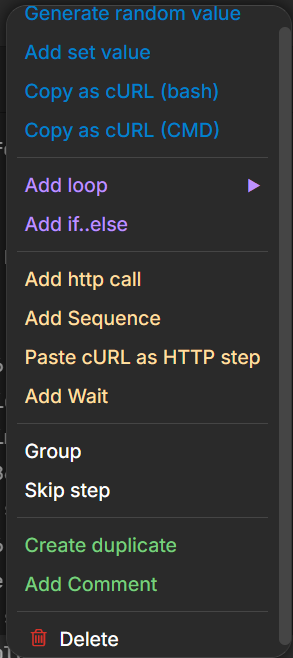
Use the steps list as the main overview of your sequence.
|
Option |
Description |
|---|---|
|
Generate random value |
Creates a step that generates a random value (e.g., string/number) for use in later requests. |
|
Add set value |
Adds a step that assigns a fixed value to a variable or header/parameter. |
|
Copy as cURL (bash) |
Copies the selected HTTP step as a |
|
Copy as cURL (CMD) |
Copies the selected HTTP step as a |
|
Add loop ▸ |
Opens options to insert a loop controller to repeat one or more steps. |
|
Add if..else |
Inserts a conditional controller to run different branches based on a condition. |
|
Add http call |
Adds a new HTTP request step to the sequence. |
|
Add Sequence |
Nests another sequence inside the current one as a reusable block. |
|
Paste cURL as HTTP step |
Converts a previously copied |
|
Add Wait |
Inserts a wait/delay step between other steps. |
|
Group |
Groups selected steps so they can be managed or moved together. |
|
Skip step |
Marks the selected step so it is not executed during a run/preview. |
|
Create duplicate |
Creates a copy of the selected step (or group of steps). |
|
Add Comment |
Adds a non-executing comment step for documentation and notes. |
|
Delete |
Removes the selected step or group from the sequence. |
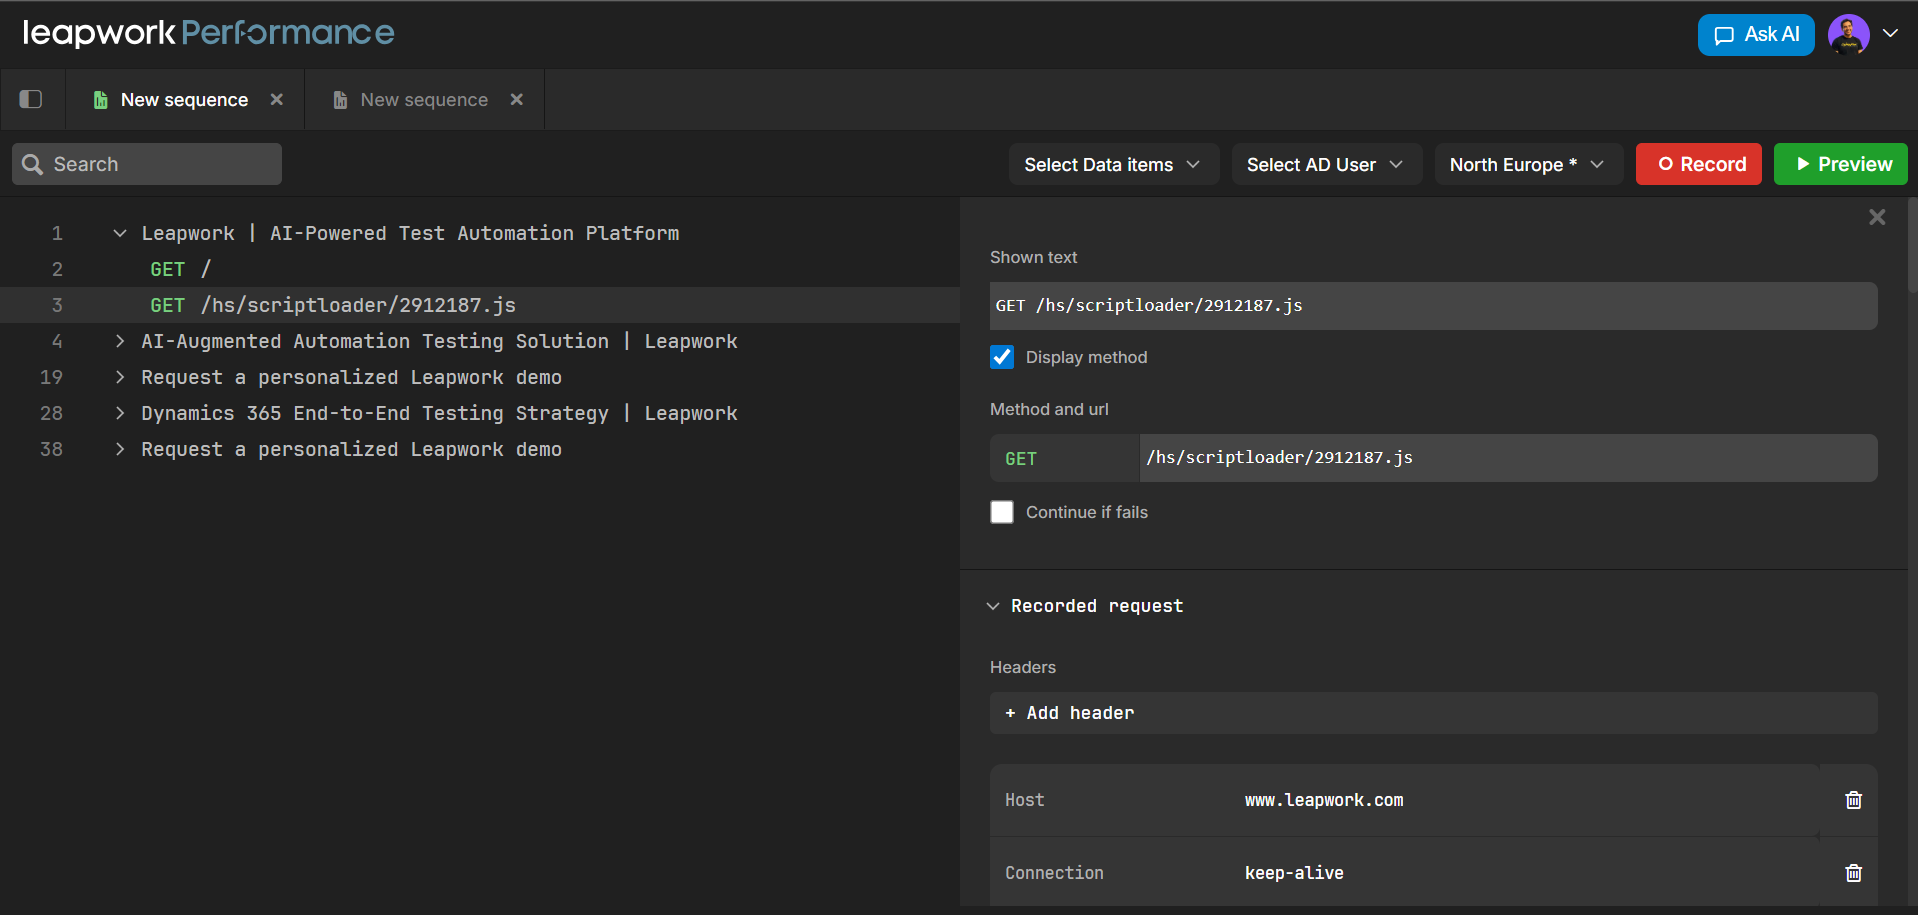
Step details panel
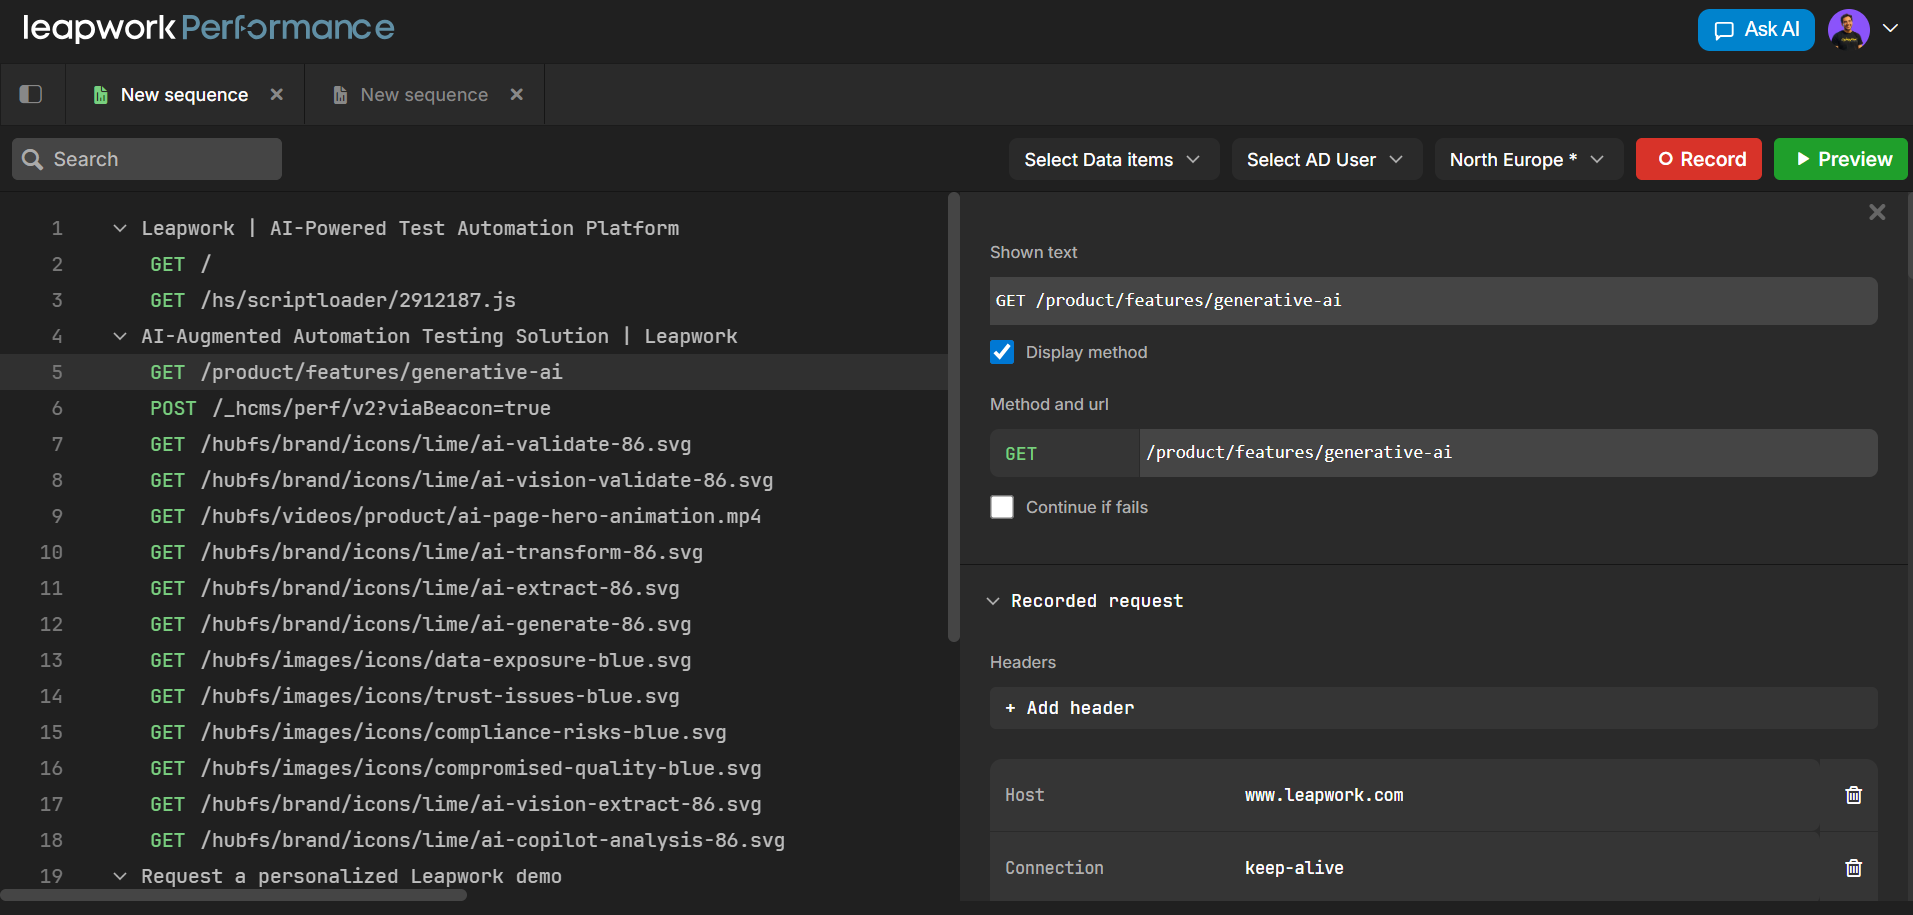
The right side of the window shows the step details panel for the step you have selected in the middle list. This area is focused on one API call or request at a time and is where you configure how that step behaves.
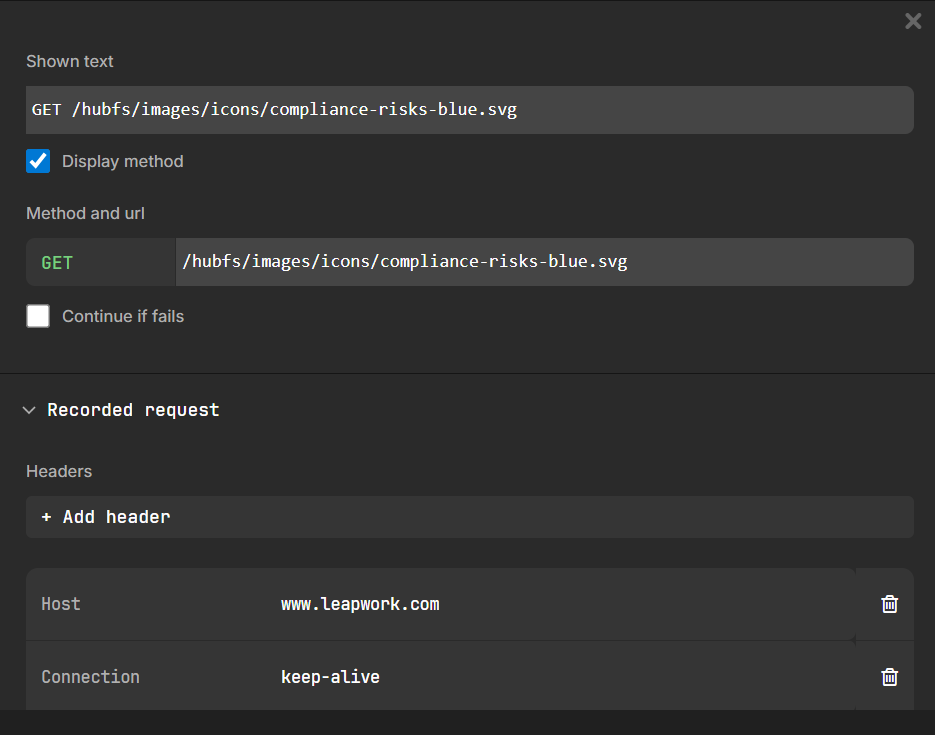
At the top, you see a request overview:
-
HTTP method and URL – confirming which endpoint the step calls and how; both can be edited.
-
Path and query parameters – listing parameters present in the URL, which you can parameterize or edit.
-
Authentication/security – showing how the step is authenticated, for example via the AD User selected for the sequence or via tokens and headers.
Next, you can refine the request through dedicated sections:
-
Headers
-
View all HTTP headers sent with the request.
-
Add new headers or edit existing ones.
-
Replace static header values with variables or data items.
-
Remove headers that are not needed for the test.
-
-
Body (payload)
-
See the full payload (for example JSON or XML) for methods like POST and PUT.
-
Replace fixed values (such as user IDs, order IDs, or other test data) with references to data items.
-
Prepare different data variations that can be driven by your data items.
-
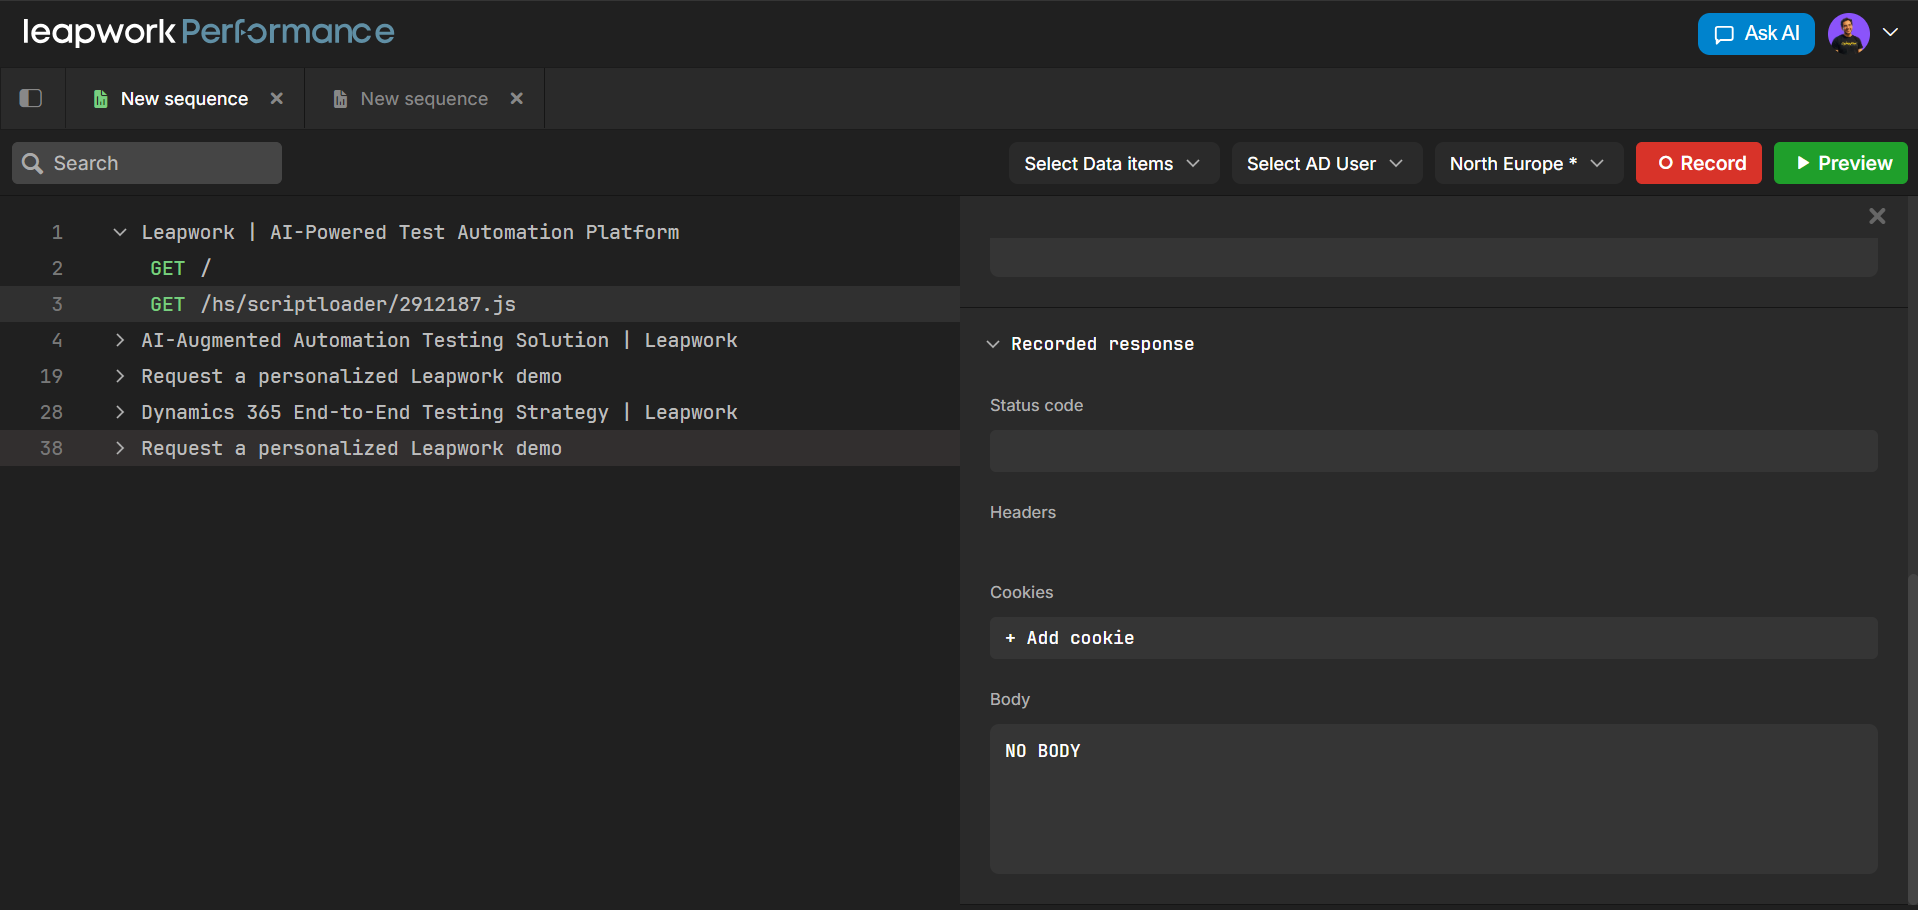
The step details panel also provides tools for parameterization and variables. During a Preview run, the step details panel also displays the response for the selected step, including:
-
Response status code
-
Response headers
-
Response body
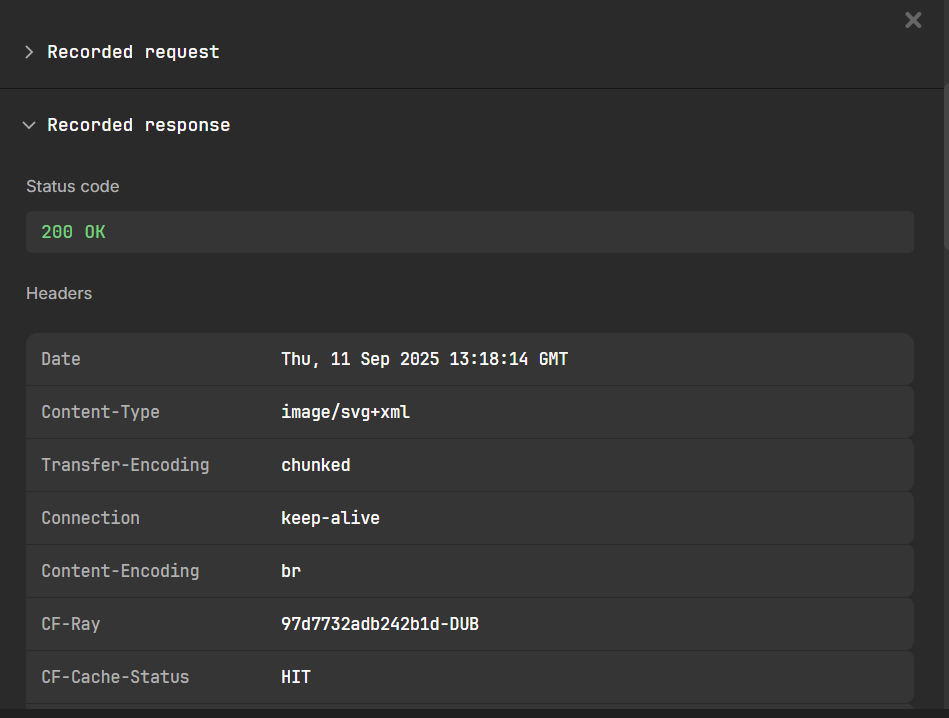
This information helps you verify that parameterization works correctly, identify values to reuse in later steps, and troubleshoot errors directly in the sequence editor.
Viewing and editing an API step
When you work with sequences, the step details panel becomes your main workspace for configuring requests. A common workflow is to start with a recorded flow and then refine each step so it becomes maintainable and data-driven.
To open a step, simply select the request in the steps list. The right panel updates immediately to display its method, URL, headers, body, parameterization, and assertions.
Once the step is open, you can adjust how the request behaves. For example, you might:
-
Update the method or URL if the recorded request does not match your test environment
-
Modify or replace headers
-
Edit the request body and replace fixed values with data references
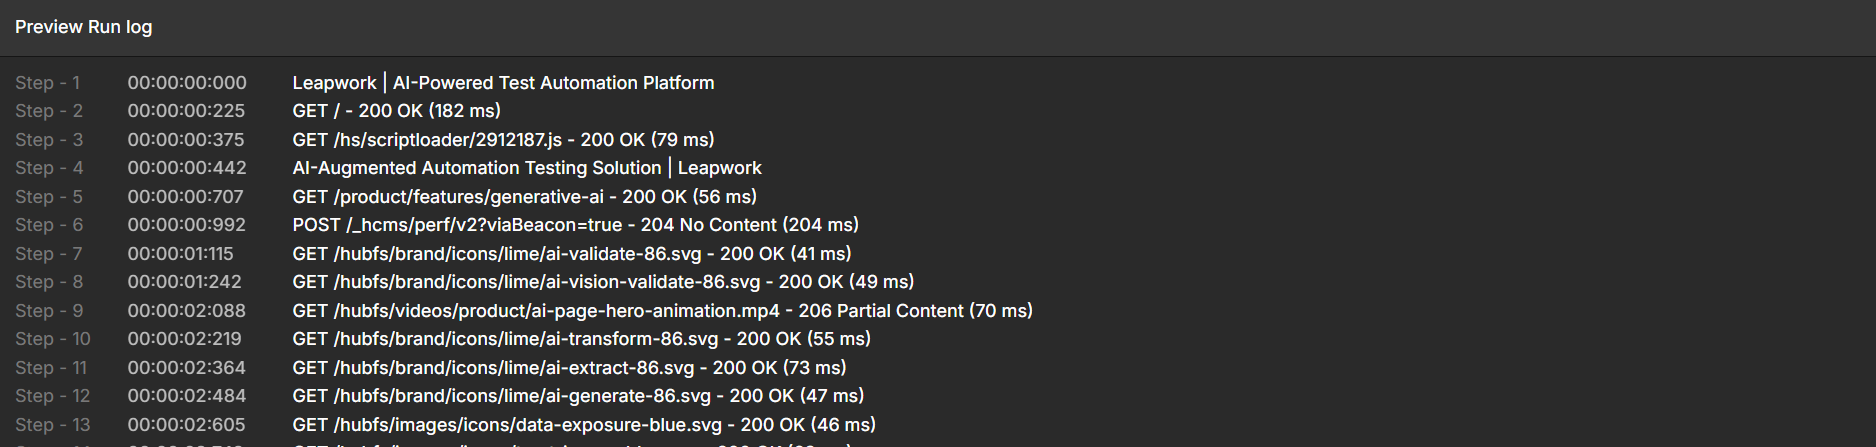
Preview run log
When you use Preview in a sequence, Leapwork Performance runs the sequence once and shows detailed results without starting a full load test. The preview run log gathers this information in one place so you can quickly understand what happened during the run.
You can think of the preview run log as a debug view for your sequence. It shows which steps ran, how they behaved, and where any problems occurred.
What the preview run log shows
After you run Preview, the log provides a structured view of the run results. It helps you quickly determine whether the sequence behaved as expected.
The log typically shows:
-
Per-step outcome
For each step in the sequence, you can see:-
Whether the step was executed or skipped
-
The final step status, such as success, failure, or assertion failure
-
-
HTTP status codes and timings
For API steps, the log highlights:-
The HTTP status code returned by the request
-
Basic timing information, such as how long the request took to complete
-
Use the preview run log for troubleshooting
The preview run log is most helpful when you are building or adjusting a sequence and want to validate your changes quickly. By iterating between the step details panel and the preview run log, you can gradually refine the sequence until it behaves as expected and is ready to run in a load timeline.