
Take full control of your workflow with a release designed to keep you moving: undo and redo edits instantly, fine-tune how runs end to match your goals, and import HAR or JMX files to reuse proven scripts faster and with less manual work.
What’s new
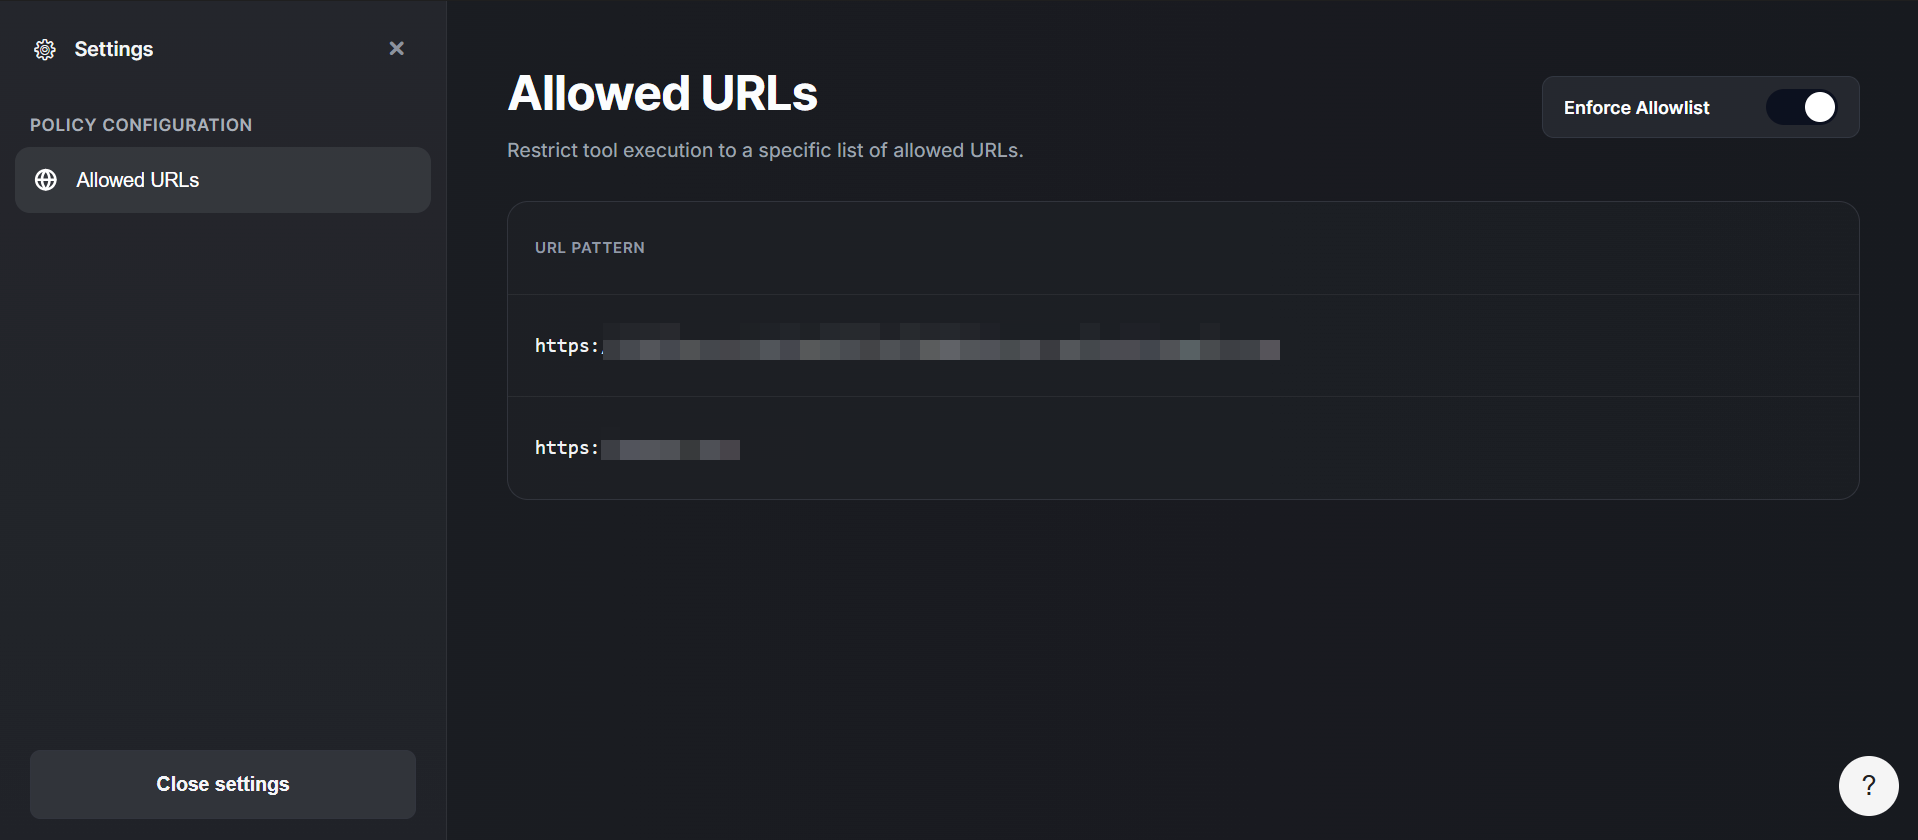
Allowed URLs in recording
You can now define which URLs are allowed during recording, so captured traffic stays focused on the domains that matter and excludes noisy third‑party calls. This helps you build cleaner, more stable sequences from real browser activity.
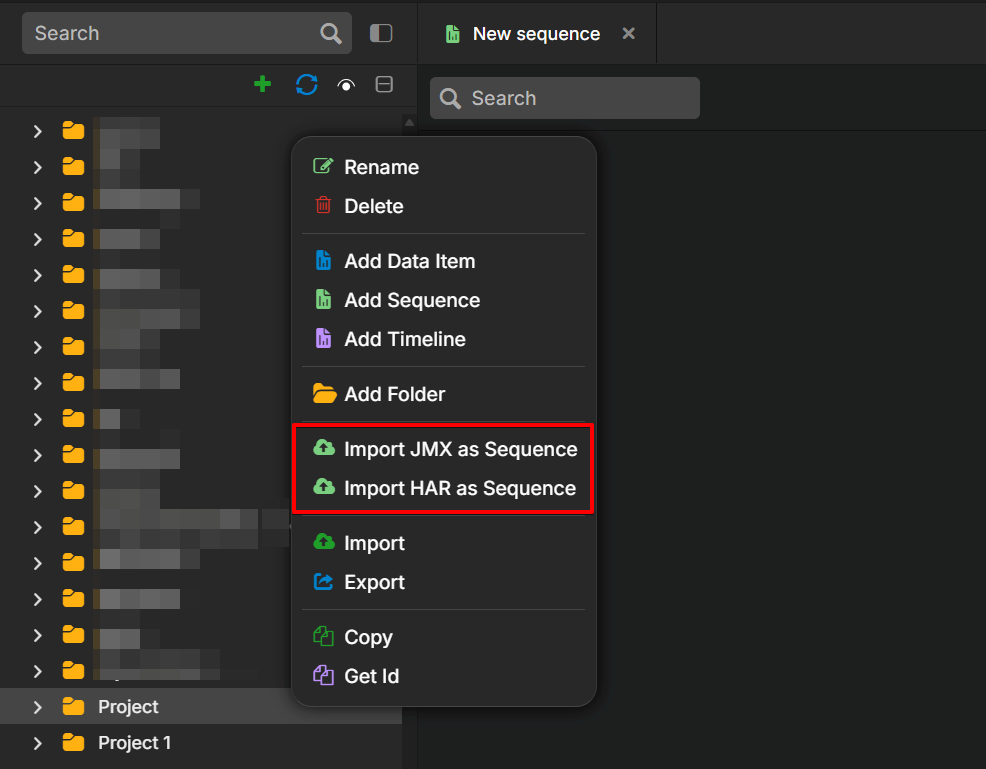
Import HAR and JMX scripts
Performance now lets you import HTTP Archive (HAR) and Java Management Extensions (JMX) files into sequences, so you can quickly turn captured browser traffic and existing JMeter‑style scenarios manually. This is especially helpful for security‑conscious teams that can’t use a proxy, because HAR files provide a proxy‑free way to bring real traffic into Leapwork Performance.
When you import JMX files, Performance supports common elements such as If/Else, HTTP calls, Wait steps, For loop counters, and comments. Other controllers and samplers appear as comments to indicate they are not yet supported.
New Add save value option in sequences
A new Add save value option in the sequence context menu lets you capture values from sequence output and reuse them later in the same run. You can store IDs, tokens, or other dynamic data without adding separate helper flows.
End condition run for duration or target executions
Runs now support two end conditions, as shown in the UI. Run for duration or Run until target execution met. This gives you precise control for time‑boxed performance tests and fixed‑iteration scenarios without manual monitoring.
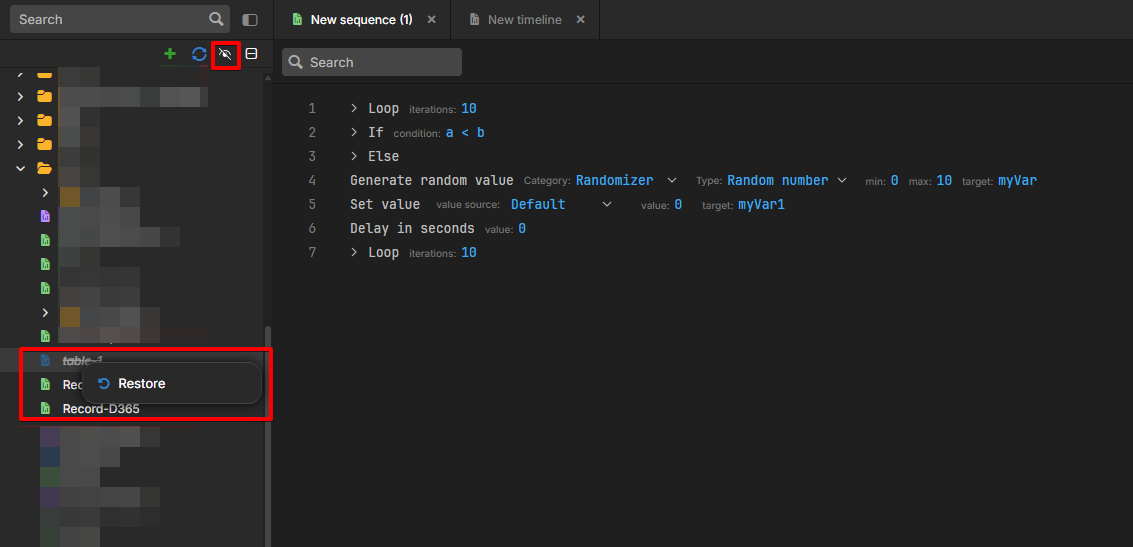
View and restore deleted items
Performance now lets you view deleted sequences and other assets using the show deleted items toggle (eye icon). When this is turned on, deleted items appear in the workspace so you can restore anything removed by mistake. This makes cleanup safer and gives you a simple way to recover work without rollback or support.
What’s updated
Timeline badges and execution progress visibility
Timeline runs now show clearer badges and execution progress, so you can see which parts of a run are active, completed, or waiting at a glance. This makes it easier to monitor complex runs without digging through logs.
Shown text attribute in the inspector panel
The inspector panel now includes a Shown text attribute, so you can see the text actually displayed for an inspected element. This helps you validate what users see and troubleshoot mismatches in labels or content.
Support for dictionary data items in custom Playwright scripts
You can now provide a custom Playwright script to handle authentication flows in Performance. This enables support for complex login mechanisms beyond Microsoft AD, including SSO providers such as Okta or Auth0, multi-step redirects, and pop-up-based authentication.
With this capability, you can script the login process in Playwright and let Performance capture the required authentication tokens and cookies for use in subsequent API calls. This makes it easier to automate applications with complex enterprise authentication.
Bugs and Improvements
This release includes the following fixes to improve stability and reliability:
-
Fixed an issue where runs did not execute when a single‑track item start time was greater than 15 seconds in delayed provisioning scenarios.
-
Fixed inconsistent behaviour when managing or editing items, so common actions now behave more reliably across the client.
-
Fixed a defect that could interrupt or misorder back‑to‑back or multi‑part runs in some scenarios.
-
Fixed an issue where search or filter results did not always match what was displayed in the client.
-
Fixed intermittent failures during preview or full runs in specific configurations to improve run stability.
-
Fixed an underlying issue in sequence handling that could lead to unexpected behaviour in complex scenarios.
-
Fixed a configuration issue where some environment or run settings were not consistently applied.
-
Improved UI clarity by hiding the Performance Environment heading and trimming low‑value error details.