
Dashboards give you a clear, visual view of your automation run results.
-
They make it easy to track performance, understand trends, and quickly share insights with colleagues and management.
-
You can create multiple dashboards, making it easy for each user, project, business unit, or product area to have their own customized visual overview.
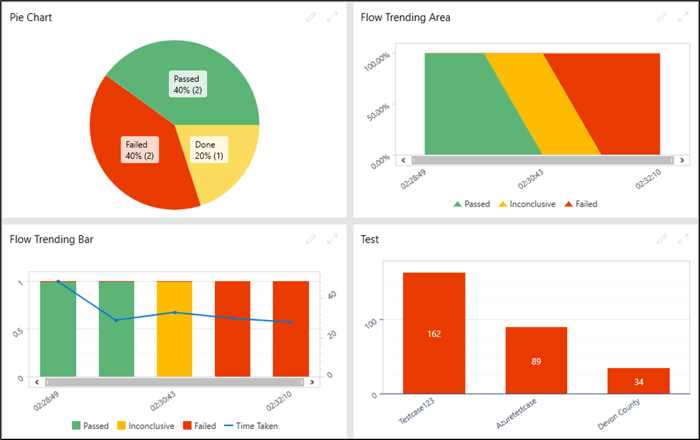
A dashboard consists of one or more widgets, each showing the configured results of the automation flow runs.
The following widgets are available in the dashboard:
-
Flow Trending Area
-
Flow Trending Bar
-
Most Failed
-
Pie Chart
Leapwork Flow can be configured to run in full-monitor-mode, allowing the dashboards to be shown on a monitor.
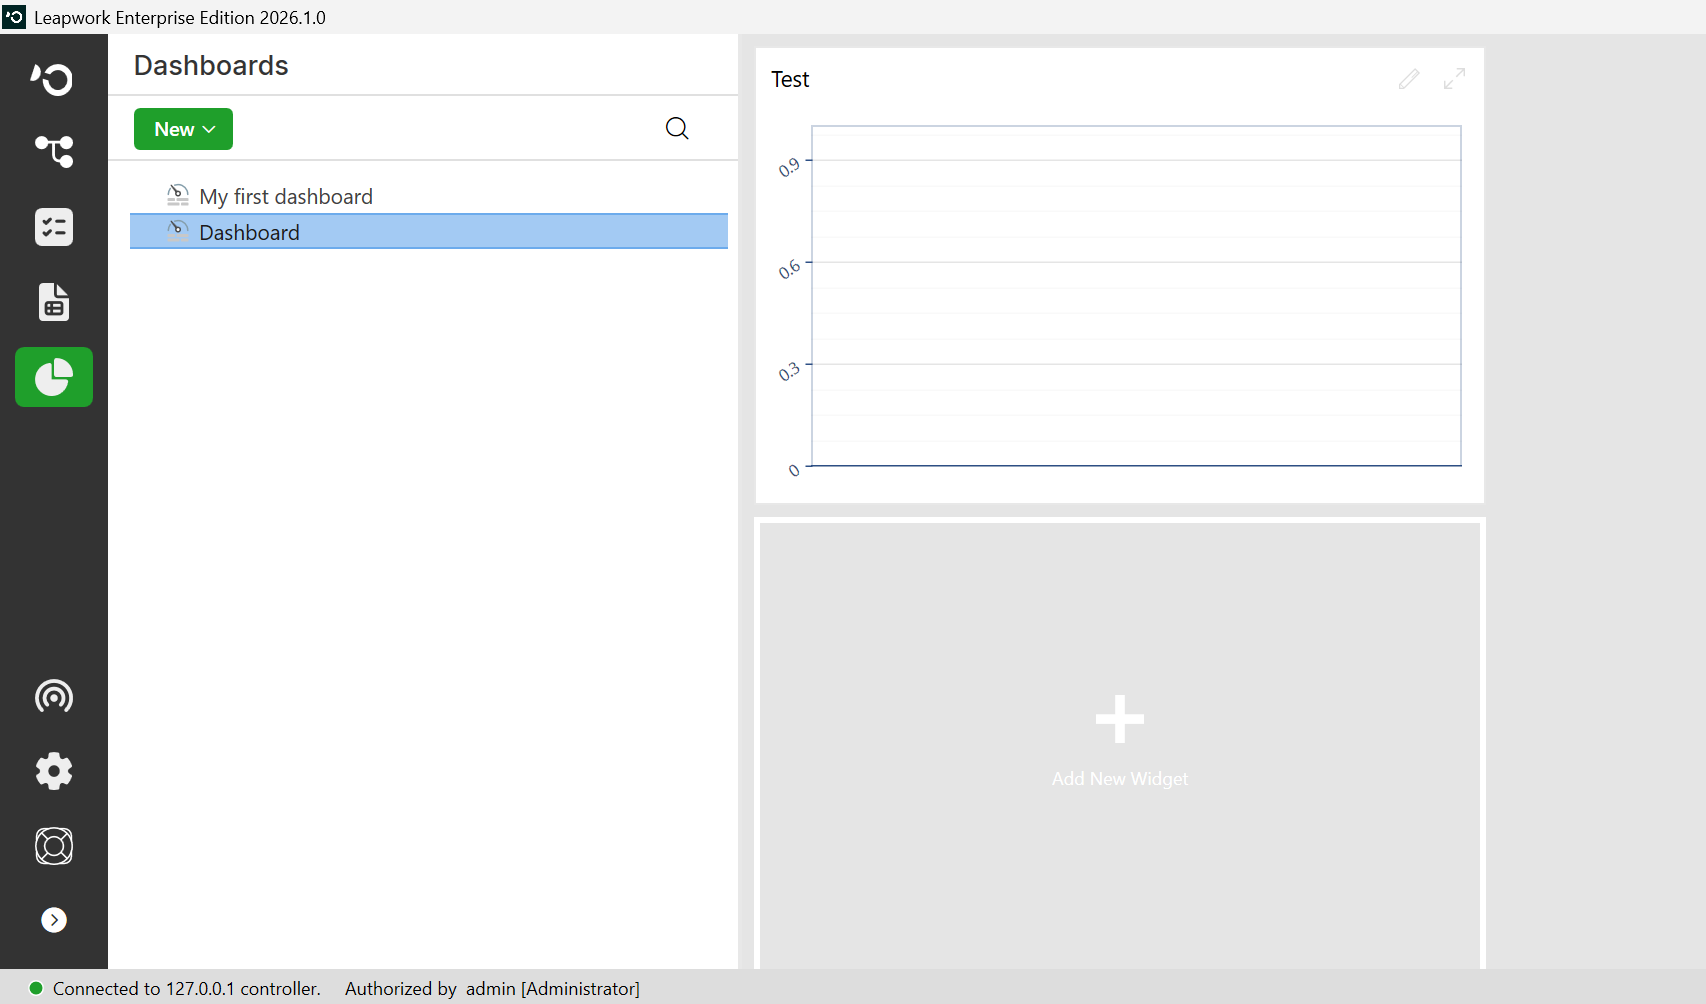
Create New Dashboard
To create a new dashboard:
-
Click on Dashboards on the main menu to open the dashboard area.
-
Click New.
-
Select Dashboard. This will add a new dashboard to the list of dashboards and allow you to specify a title for the new dashboard.
Note: The screenshots on this page use the Elegance Design, introduced in 2025.3. If you are using an earlier version, your layout may look different.
-
Click on Add New Widget section to add a new widget to the dashboard. This will open the Create New Widget dialogue.
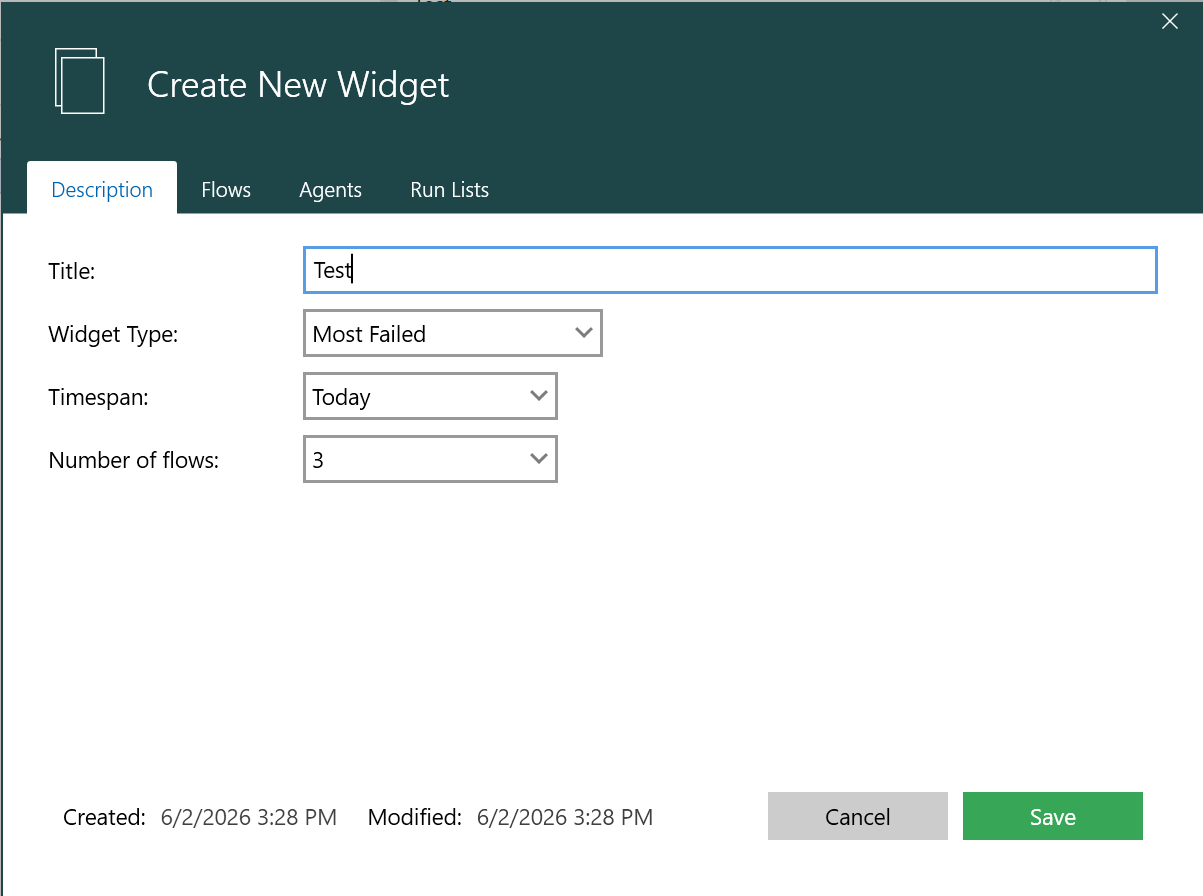
Using Description tab, you can define the widget details by entering the title, selecting the widget type, choosing a time span, and setting the number of flows to include.
-
Enter the information in the fields as described below.
|
Title |
Choose a relevant title for the widget. |
|
Widget Type |
Choose from the following widget types: Flow trending Area, Flow trending Bar, Most Failed, Pie Chart. |
|
Timespan |
Define the timespan of the results to be displayed. |
|
Number of Rows |
Defines how many flows are included or displayed in the widget |
Depending upon the Widget type chosen, additional properties to filter results can also be set.
|
Aggregate |
The dashboard results can be aggregated if the widget type is “Flow Trending Area” or “Flow Trending Bar”. This aggregation can be done by day, week, or month based on the timespan selected. |
|
Number of flows |
This is applicable if the widget type is “Most Failed”. It allows you to set the number of flows for which the result should be shown on dashboard. |
|
Time taken |
A checkbox 'Time taken' is available for widget type “Flow Trending Bar”, which displays additional information for time taken as data points. |
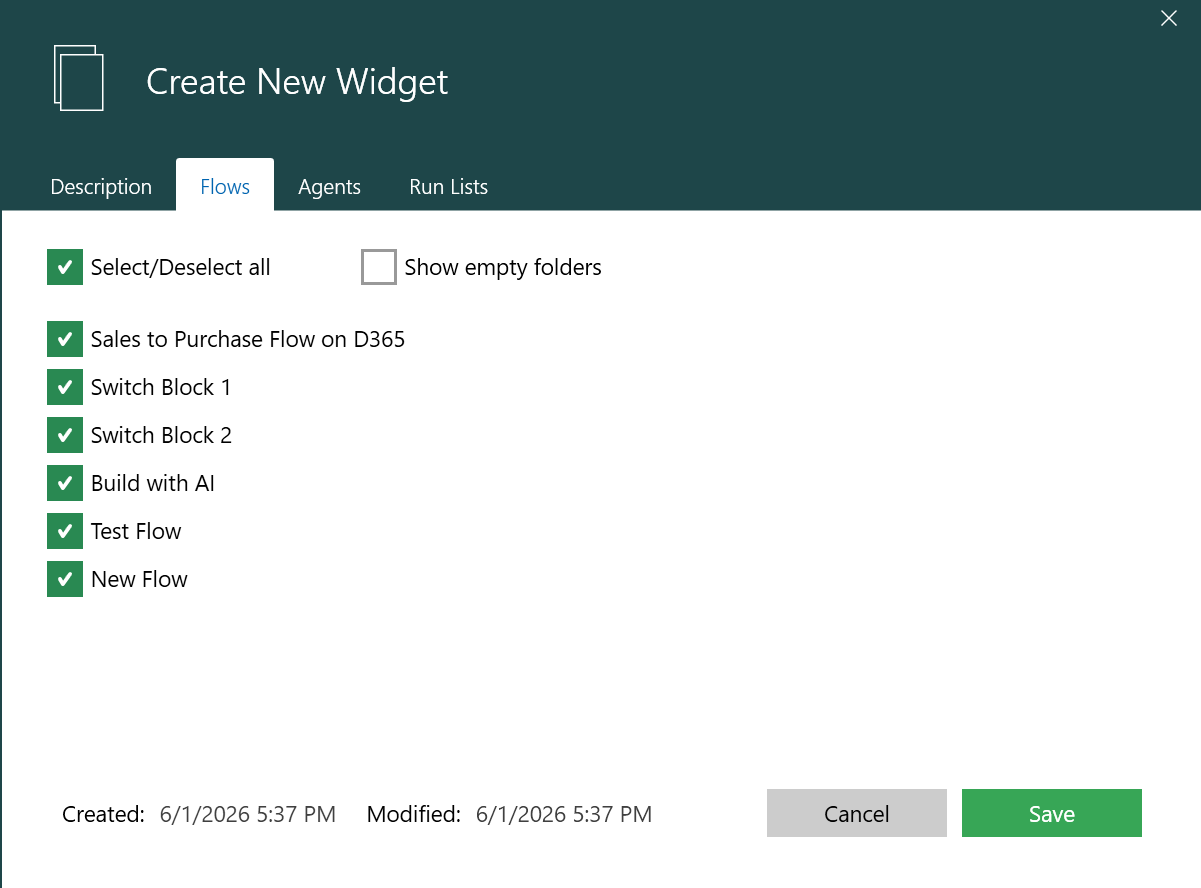
Using Flows tab, you can choose which automation results to be shown in the widget by selecting the flows or folders you want to include.
-
Select the flows and click Save.
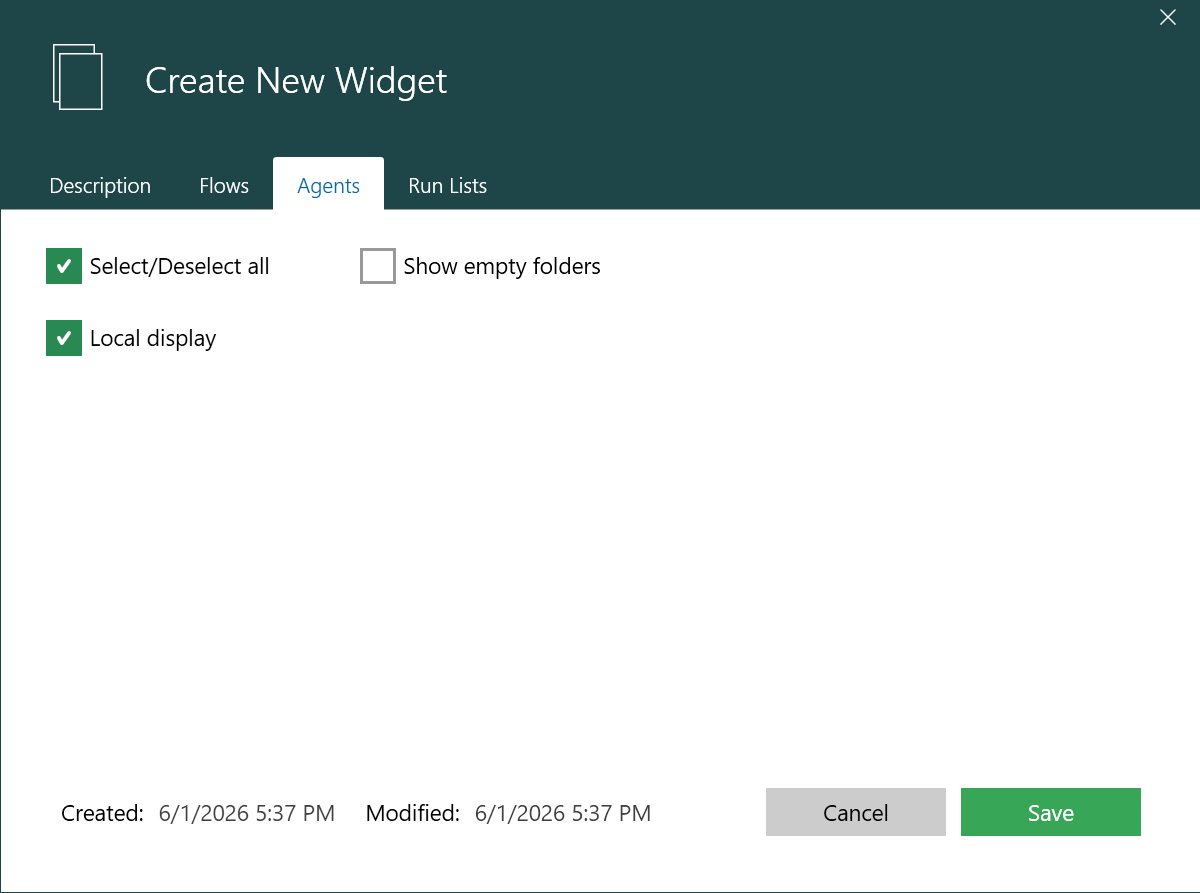
Using Agents tab, you can filter the results shown in the widget by selecting one or more environments. Only automation runs executed in those environments will be displayed.
6. Select the agents accordingly and click Save.
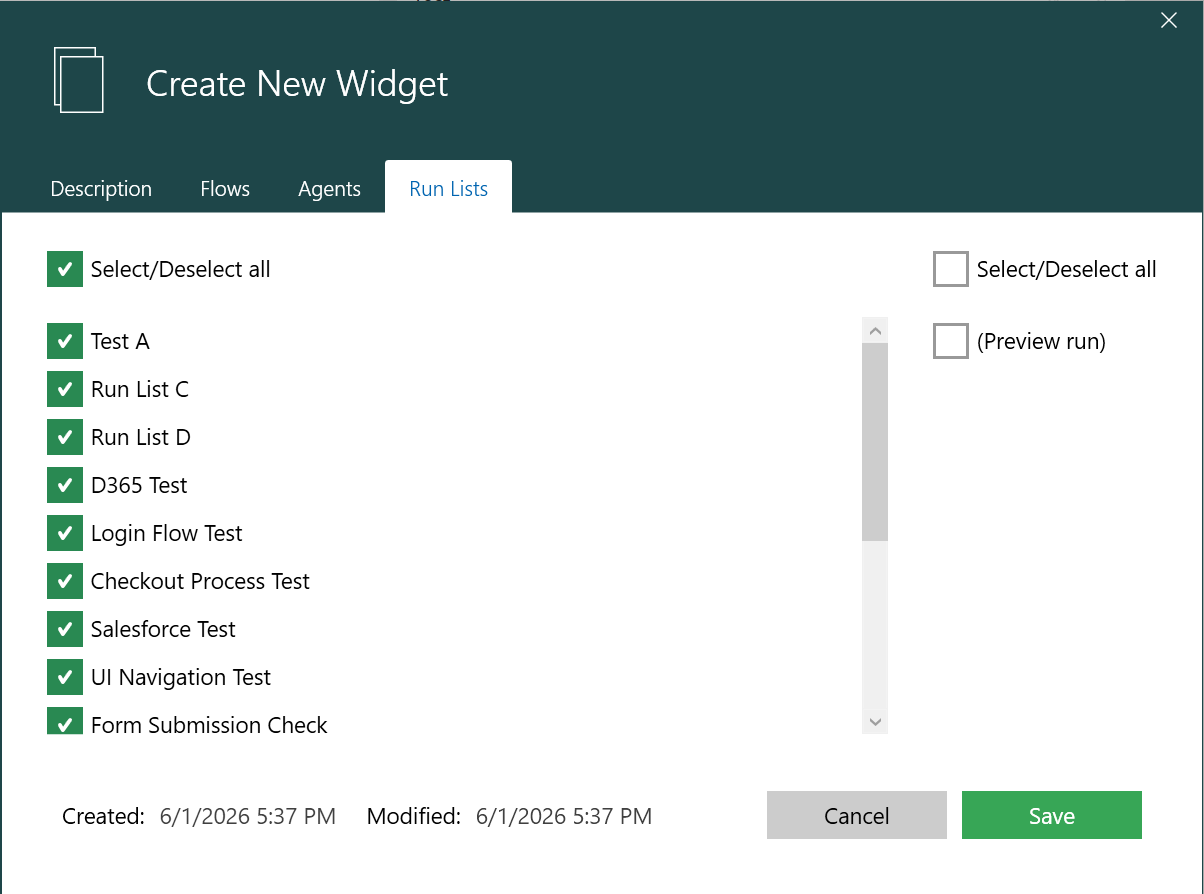
Using Run Lists tab, you can see results only from automation runs triggered by specific run lists or schedules.
-
Select the Run Lists and click Save.
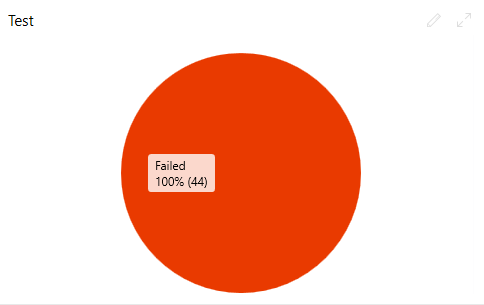
The new widget has been added to the dashboard.