
Reporting allows you to easily monitor and evaluate the state of automation flows across projects, products, business units, etc. All execution results, both preview runs, manually triggered schedules and API-triggered schedules can be accessed in the reporting section.
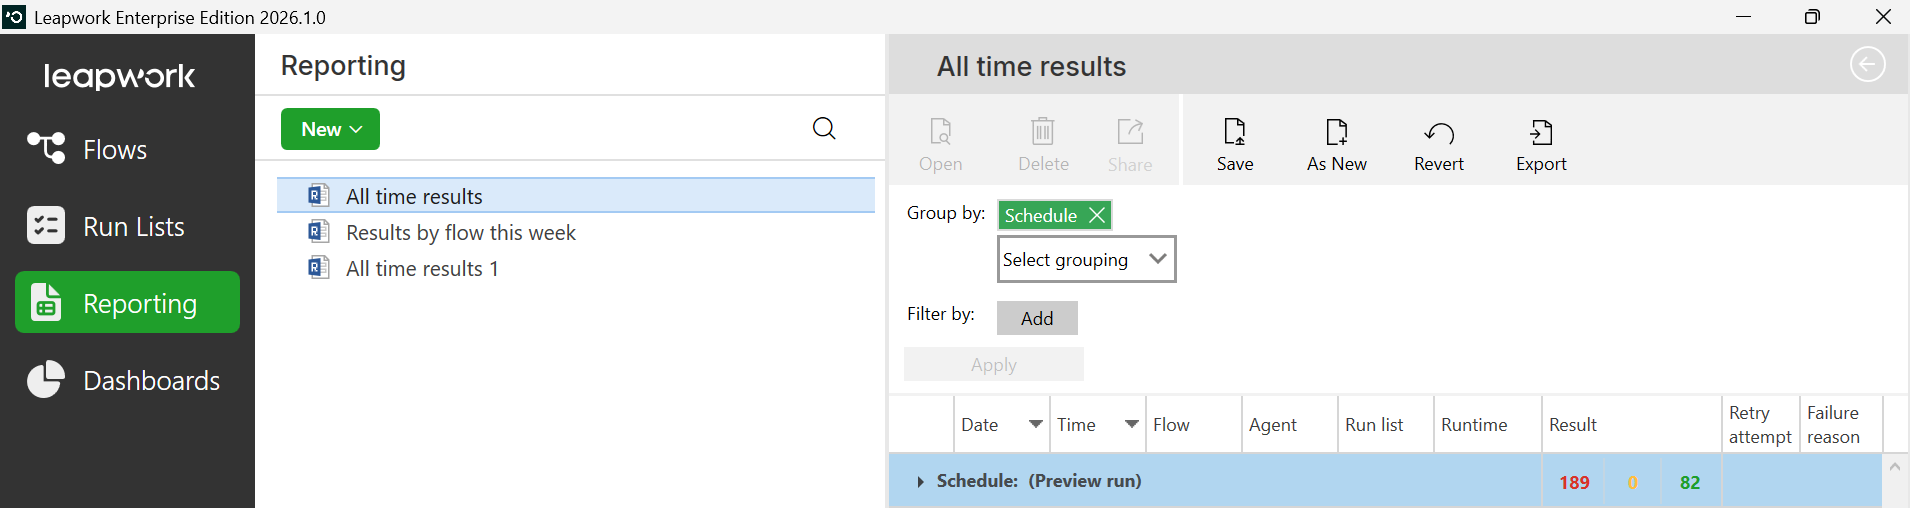
The report in the image below displays the results of automation flow runs using traffic-light indicators:
-
🔴 Red: Flow run failed
-
🟡 Yellow: Flow run completed with warnings or has an unknown status
-
🟢 Green: Flow run completed successfully
Note: The screenshots on this page use the Elegance Design, introduced in 2025.3. If you are using an earlier version, your layout may look different.
Creating a report
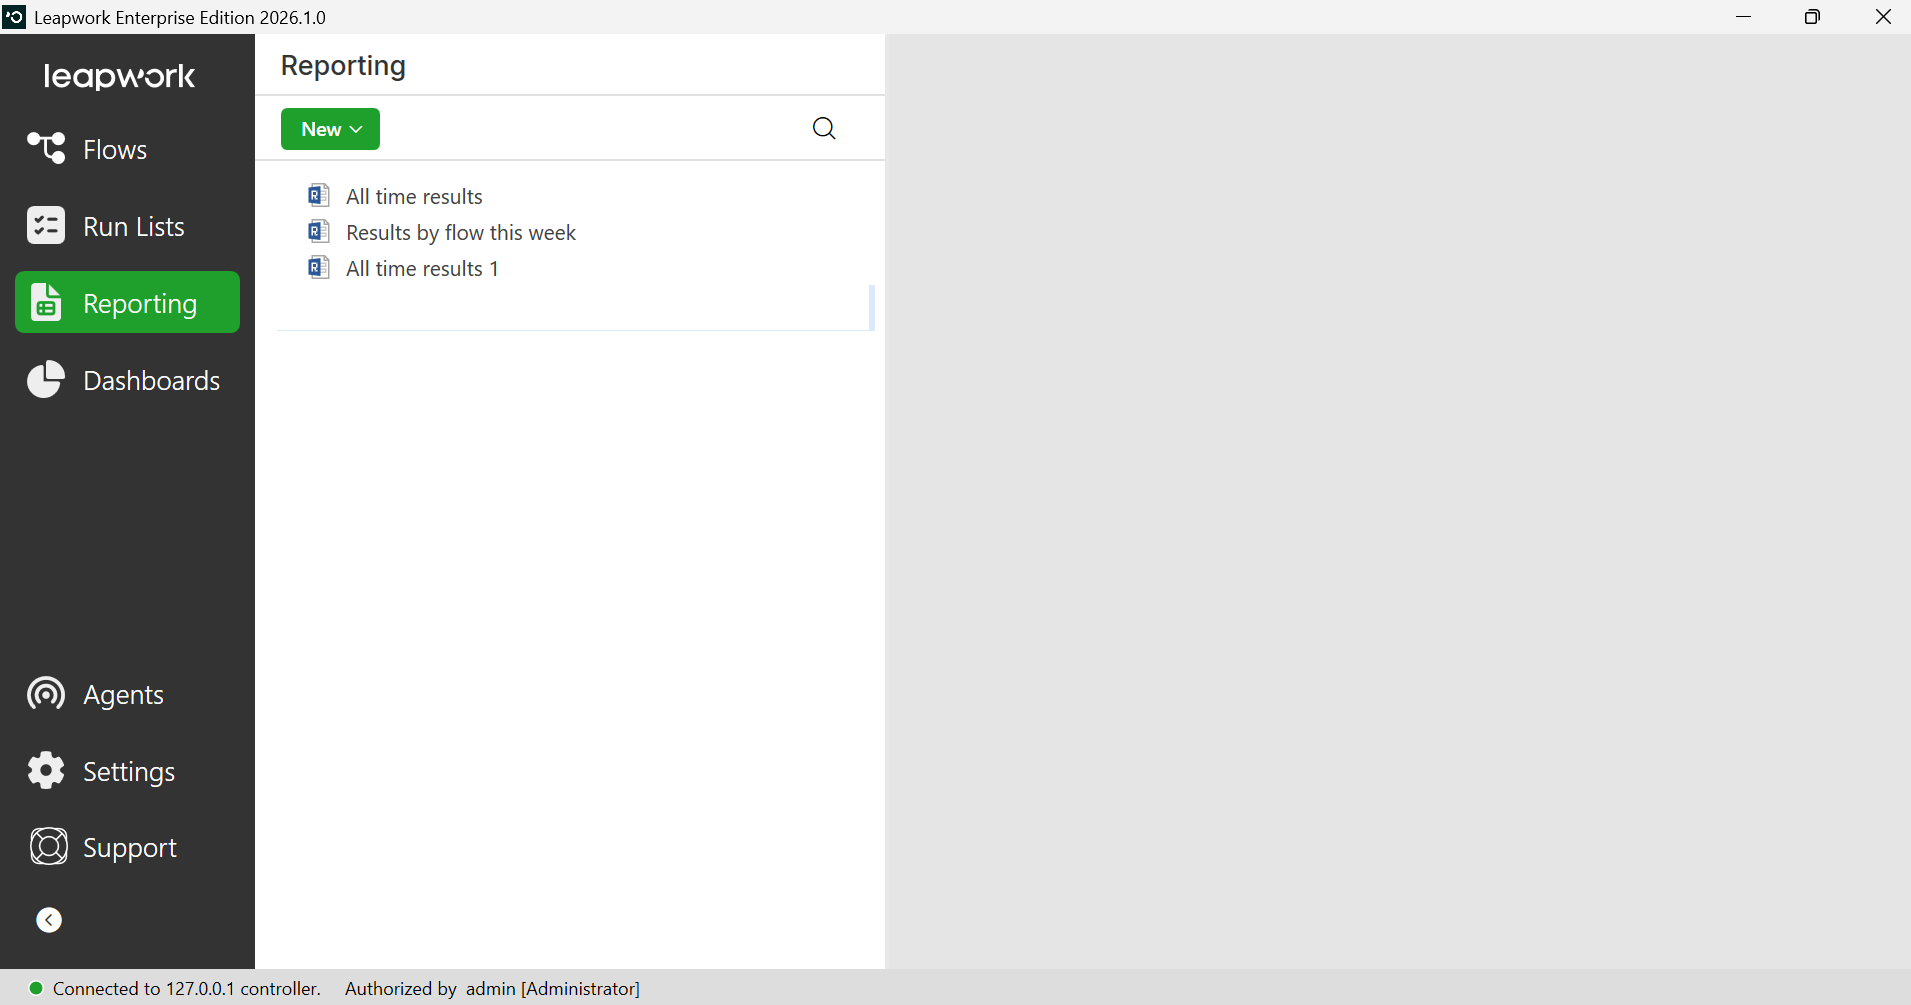
When you open the reporting section for the first time, it will by default contain two reports:
-
All time results
-
Results by flow this week
To create a new report:
-
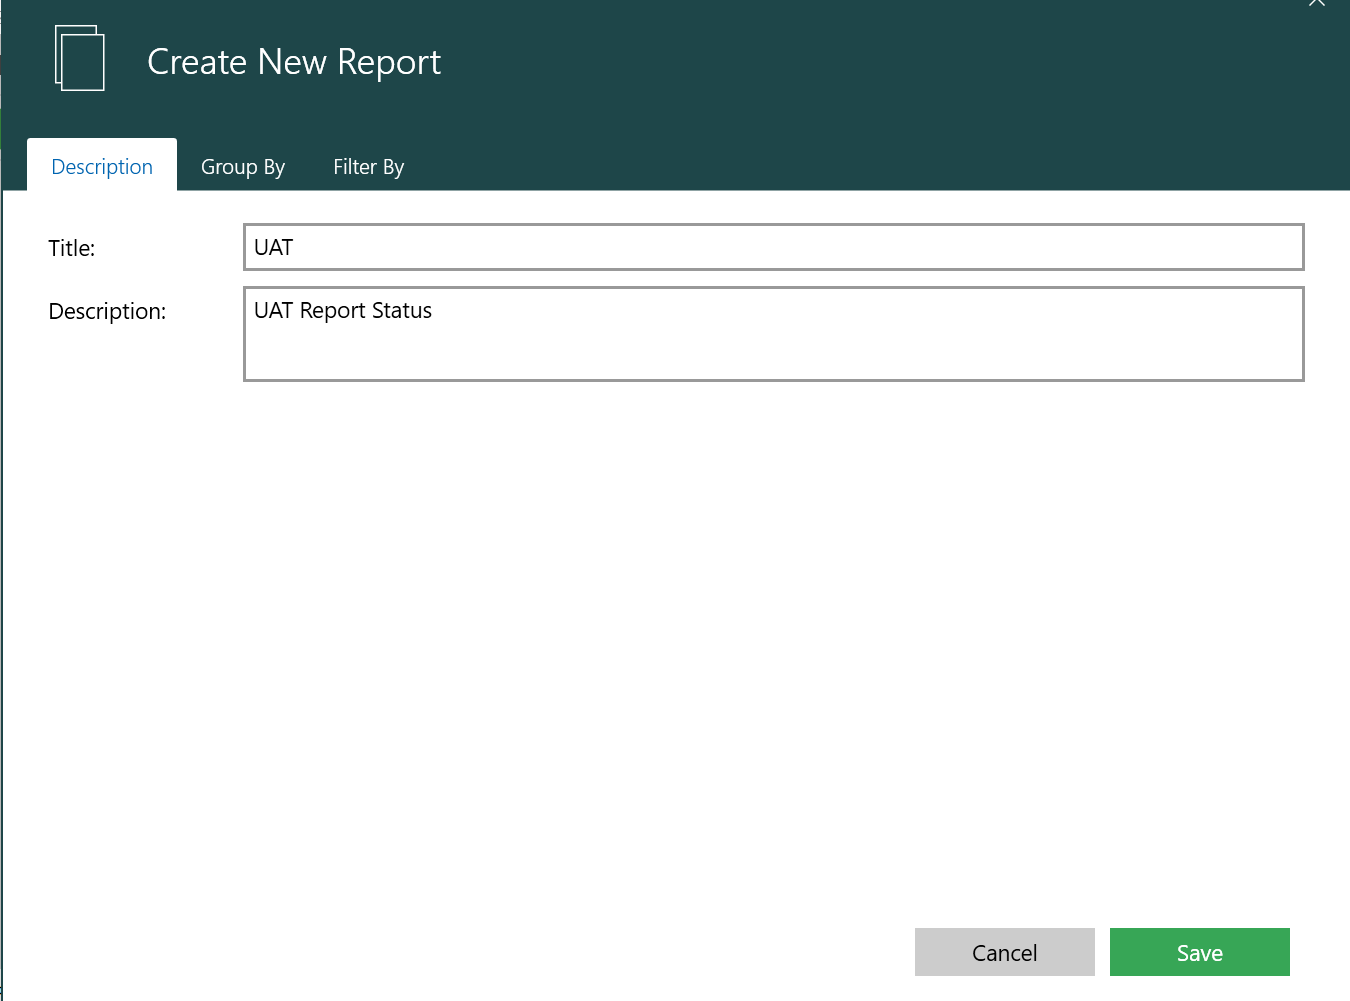
Click on the New button.
-
Select Report to open the Create New Report dialogue.
-
Give the report a title and a description.
-
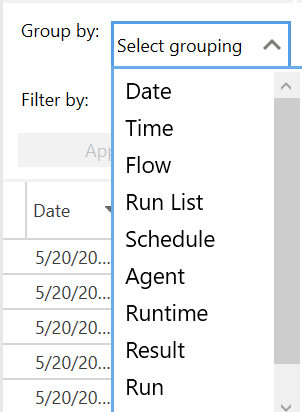
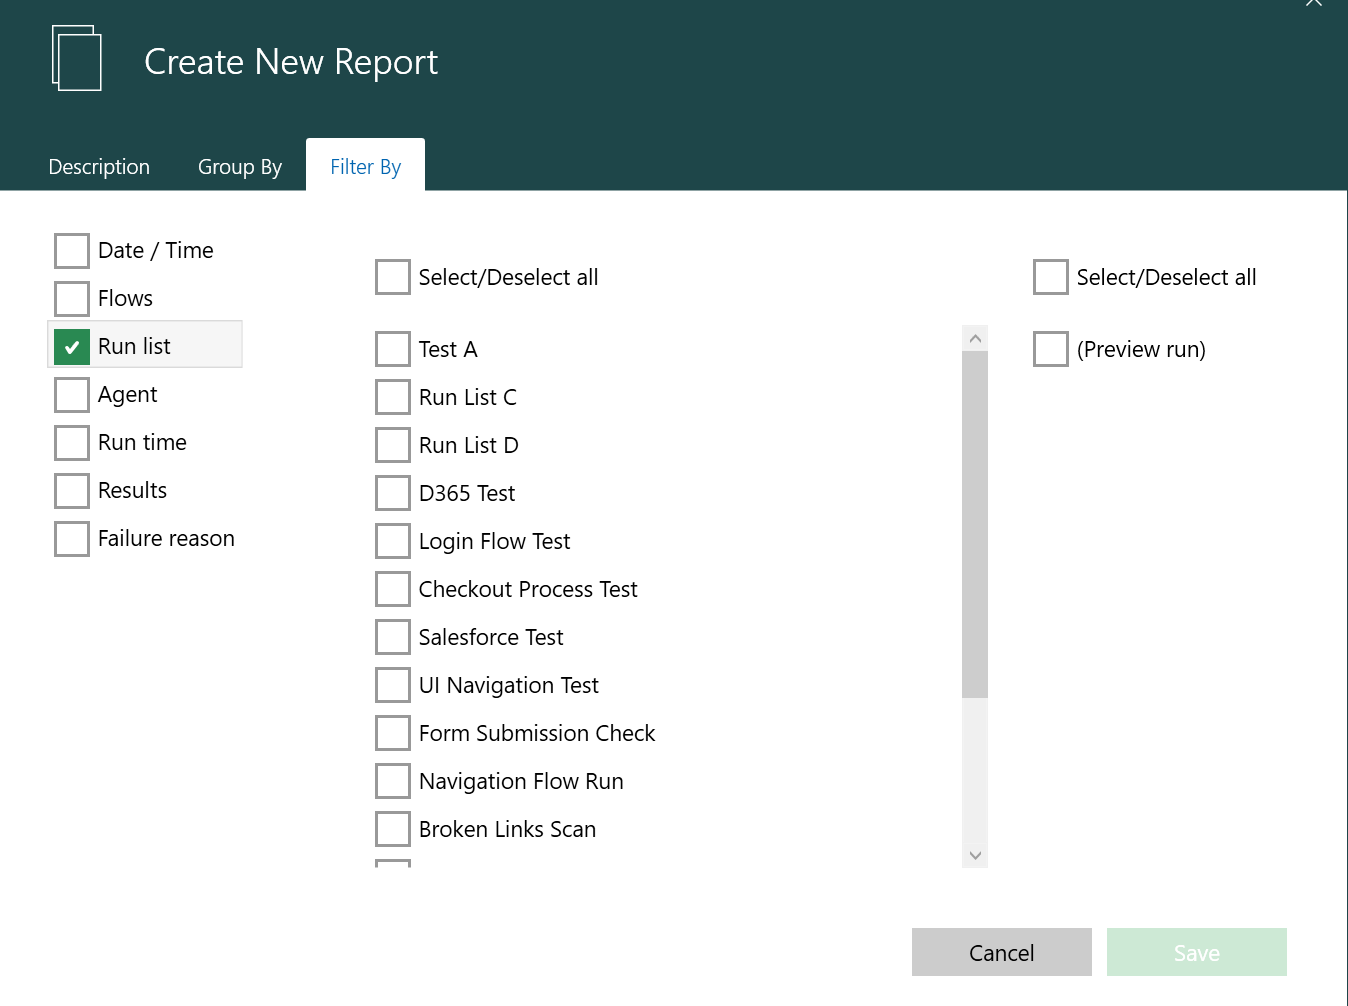
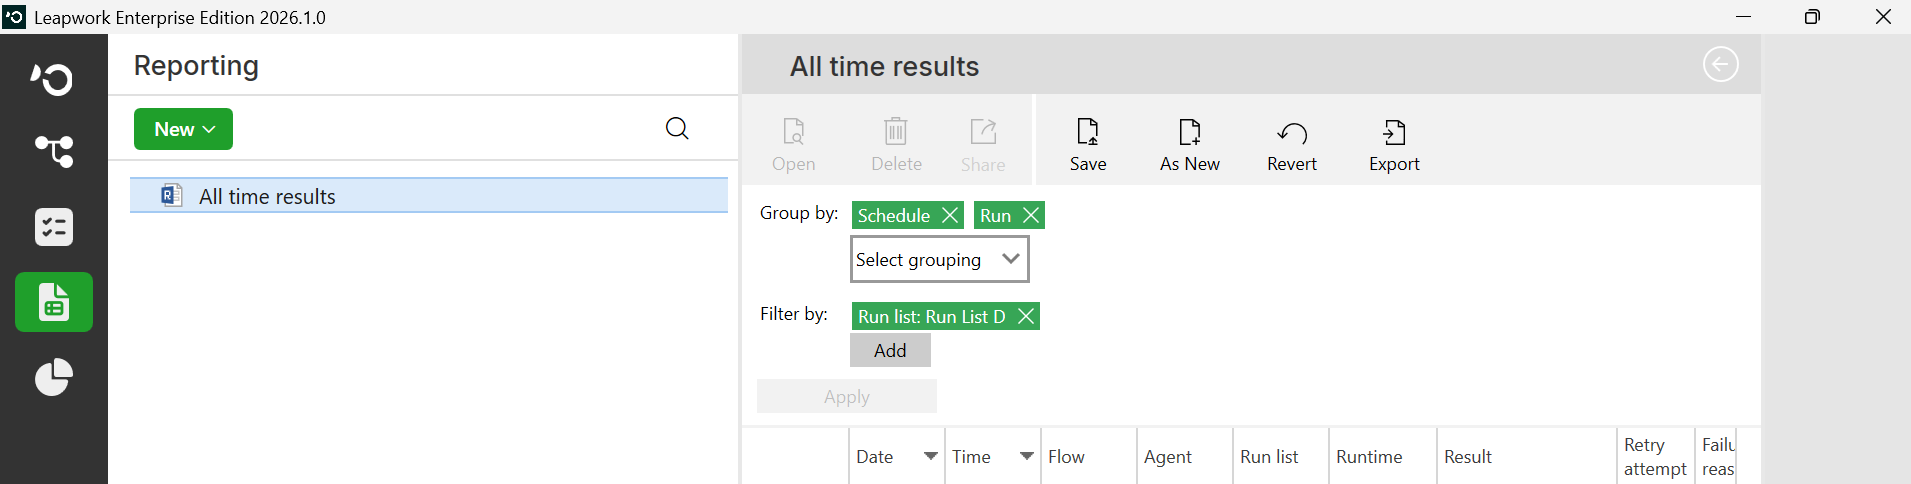
On the Group By tab, select one or more fields to group the results by.
In the example below:
-
Schedule: The name of the Schedule which executed the automation flows, is chosen as the first grouping field.
-
Run: The individual run of the schedule is chosen as the second group category. It is possible to add multiple grouping fields, creating a drill-down view in the report.
-
On the Filter By tab, specify the conditions to filter the flow run results by. In the example below, the report will only show results from automation flows that was executed as part of the run list named as New Run list and schedule named as TestSchedule.
-
Click Save to close the dialogue.
The new report is now visible in the report list on the left and in the traffic-light view in the middle panel.
Result Overview
-
To open a report, click on the reports in the list in the left pane.
-
Use the defined groups or categories to navigate to the details of the flow runs.
Failed, done, and successful runs are automatically summarized at each grouping level for a quick overview.
You can export the data part of a report to PDF, Excel, or HTML by clicking Export.
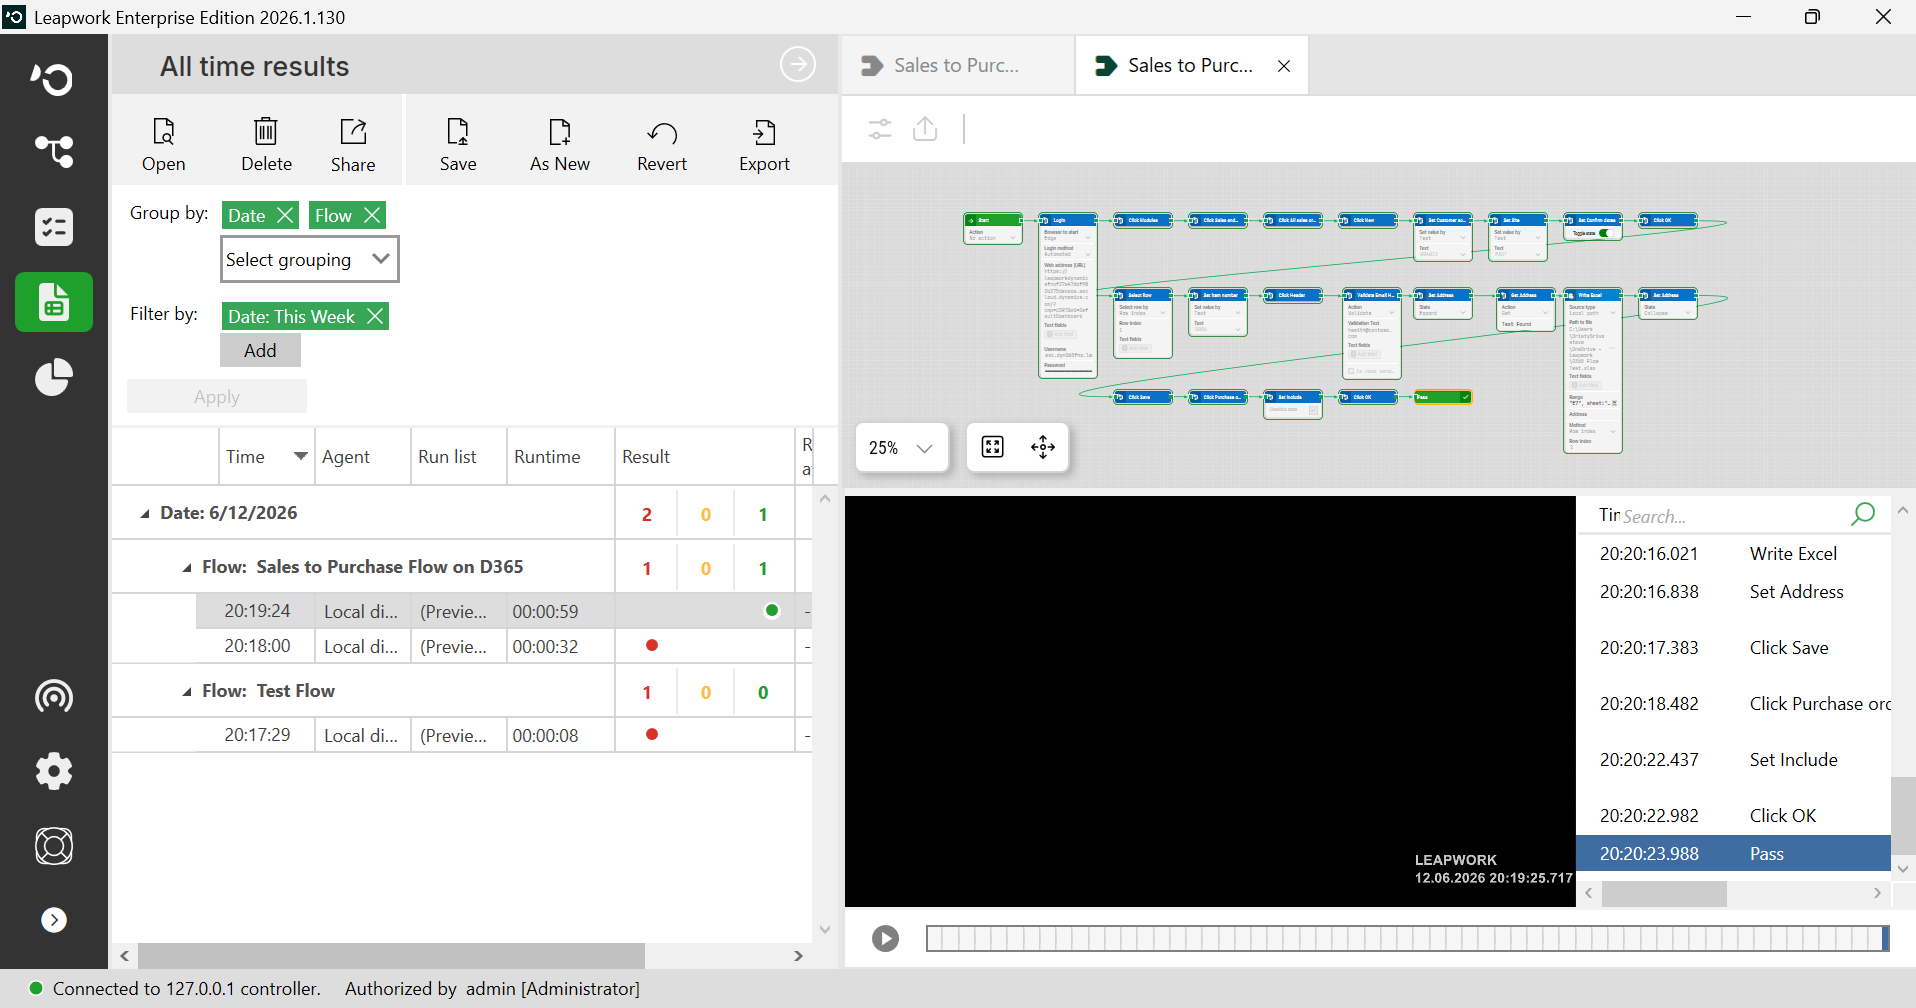
Automation Run Details
To get more information, click a report entry to view the run details in the right pane.
-
All the three elements are connected and can be inspected simultaneously. When you move the video, the highlighted step changes on the canvas and in the activity log.
-
If you select an element in the activity log, the video jumps to the time when that activity log entry was added.
The combination of the debug view, the video, and the activity log is a very powerful and intuitive tool for finding failure reasons and for handling unexpected behavior in the flows.
The recorded videos are saved as AVI files and can be accessed directly on the Controller machine depending on the security settings for the Controller machine.
To get a direct link for a video:
-
Right-click the video.
-
Select Get video file link.
The direct link to the video is now copied to the clipboard and can be inserted into e-mails, etc.