
Diagnostics
The Diagnostics feature in Leapwork Flow helps administrators and support teams collect troubleshooting data from Leapwork components and generate a diagnostics package for analysis.
The Diagnostics / Readiness Report validates the Leapwork environment by checking connectivity, configuration, system readiness, and related dependencies. This helps with troubleshooting and baseline environment validation.
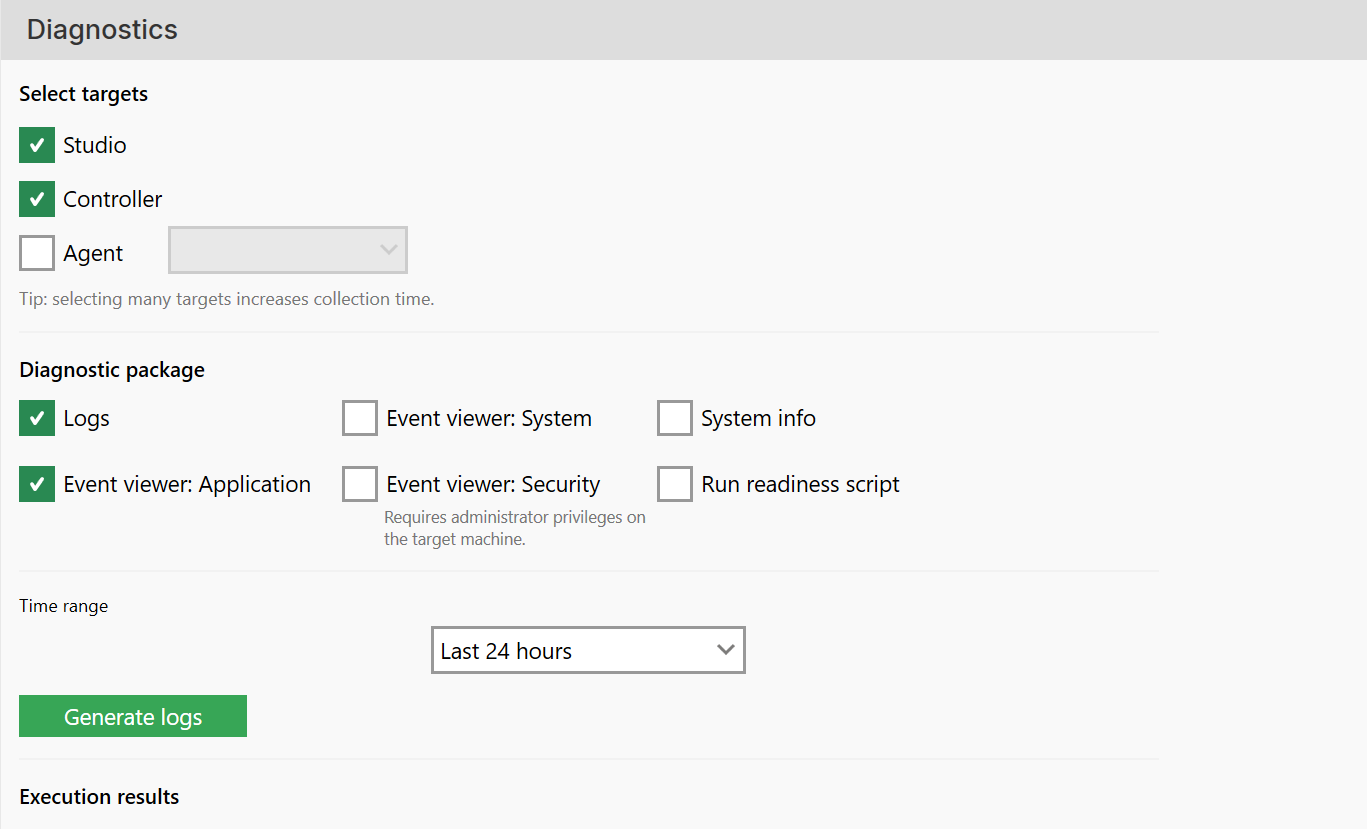
The generated package can be used to:
-
Troubleshoot connectivity issues.
-
Investigate application errors.
-
Validate environment readiness.
-
Collect system information.
-
Share diagnostic data with Leapwork Support.
Accessing Diagnostics
Open Leapwork Flow. In the top menu, click Diagnostics. The Diagnostics window opens, where you select the components and diagnostic data to collect.
The Diagnostics page allows you to select diagnostic targets, choose data collection options, specify a time range, and generate a downloadable diagnostics package.
Select Targets
The Select targets section specifies which Leapwork components to include in the diagnostics package.
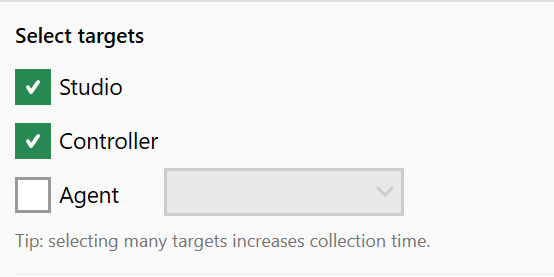
Note: Selecting multiple targets increases collection time because Leapwork gathers information from each selected component.
Flow
Collects diagnostic information from the local Flow installation such as Flow logs, configuration data, and other Flow-specific troubleshooting information to help diagnose issues related to Flow operation and performance.
Common use cases: Flow startup failures, login issues, local execution problems, and unexpected Flow crashes.
Controller
Collects diagnostic information from the selected Controller such as Controller logs, event information, system diagnostics, and readiness validation data to help identify issues affecting the Controller and overall Leapwork environment.
Common use cases: Controller connectivity issues, scheduling failures, execution problems, and environment readiness validation.
Agent
Collects diagnostics from a selected Agent machine such as Agent logs, system information, and event logs to help diagnose issues affecting Agent availability and execution.
When you enable Agent, a list of available Agents becomes available.
Common use cases: Agent offline issues, Agent execution failures, and troubleshooting problems in remote or distributed environments.
Diagnostic Package
The Diagnostic package section determines what information is collected. You can select elements from the options based on your log requirements.
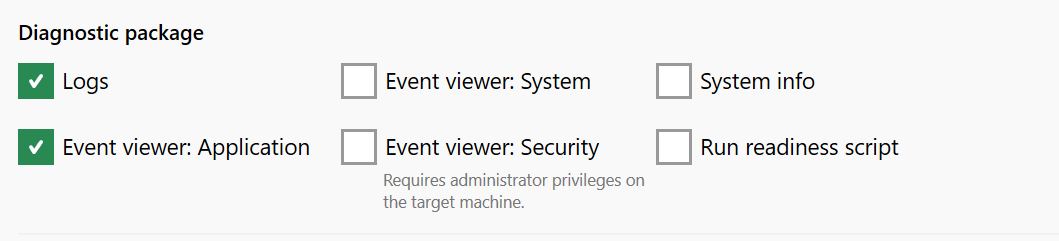
Logs
It collects the following to help investigate unexpected errors, failed executions, and performance issues:
Application logs
-
Runtime logs
-
Error logs
-
Service logs
-
Operational messages
Event Viewer:
-
Application - Collects Windows Application Event Log entries, including application crashes, warnings, and runtime exceptions, to help diagnose application failures, Flow crashes, and Controller service issues.
-
System - Collects entries from the Windows System Event Log, including operating system events, hardware-related events, and service startup failures, to help with machine stability issues, service failures, and infrastructure troubleshooting.
-
Security - Collects entries from the Windows Security Event Log, including authentication events, access-related events, and security audit entries. Administrator privileges are required on the target machine. It is recommended for permission issues, authentication failures, and security investigations.
System Info
Collects operating system and environment information, including operating system details, machine specifications, installed software information, and environment configuration, to help with environment validation, compatibility checks, and support investigations.
Run Readiness Script
Executes the Leapwork Readiness Script during diagnostics collection to validate whether the target machine meets Leapwork requirements, including connectivity, required services, port accessibility, environment prerequisites, and configuration readiness; it is recommended for new installations, upgrade validation, connectivity investigations, and pre-deployment verification.
Note: Use Run Readiness Script when validating installations or connectivity.
Time Range
The Time Range setting controls how much historical data is collected.
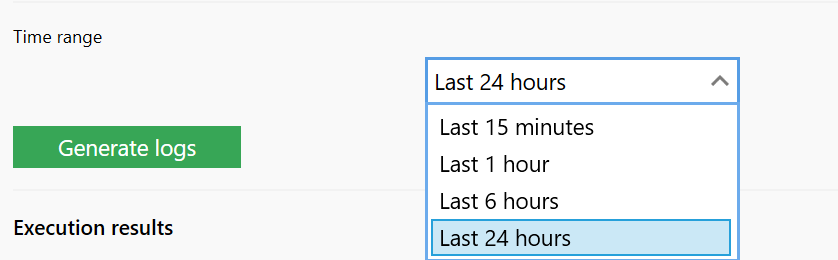
Possible use cases:
|
Time Range |
Recommended Usage |
|---|---|
|
Last Hour |
Recent incidents |
|
Last 24 Hours |
General troubleshooting |
|
Last 7 Days |
Intermittent issues |
|
Last 30 Days |
Long-term investigations |
Note: The larger the time range you select, the more data will be included in the diagnostics package. This may increase both the package size and the time required to collect and generate the diagnostics report. For faster collection and smaller package sizes, select only the time period relevant to your investigation.
Generate Logs
After selecting targets and package options, you simply need to click Generate Logs

And the diagnostics process will begin immediately.
Execution Results
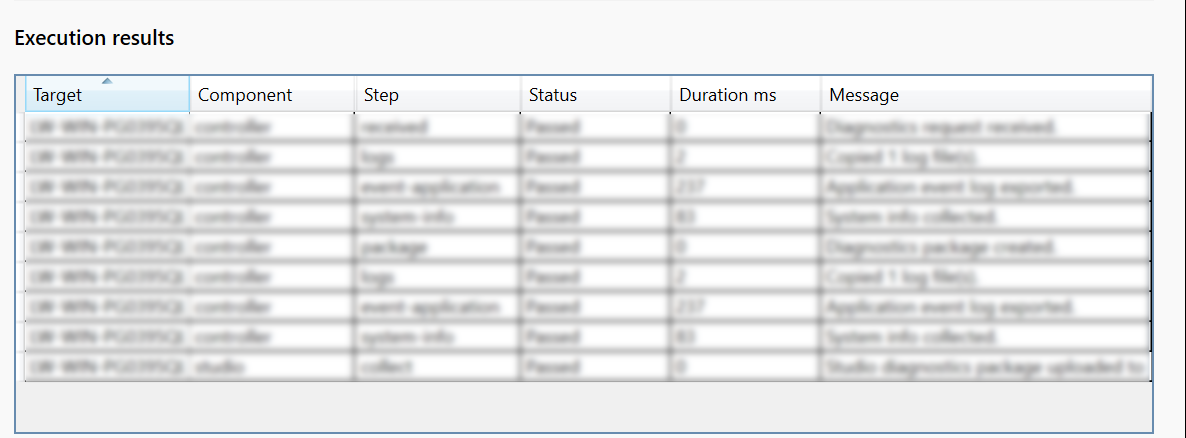
The Execution Results table displays collection progress and outcomes.
Download Package
After successful completion:

Click Download Package.
The generated archive contains:
-
Logs
-
Event Viewer exports
-
System information
-
Readiness results
-
Diagnostic metadata
The downloaded diagnostics is saved in your temp folder as:
%TEMP%\Leapwork_Readiness_Report_YYYYMMDD_HHMMSS.html
Example:
C:\Users\YourName\AppData\Local\Temp\Leapwork_Readiness_Report_20241201_143022.html
This package can be attached to support tickets for further analysis.
Delete
It removes the generated diagnostics package and execution results from the Diagnostics screen.
Use it when:
-
A package is no longer required.
-
A fresh collection needs to be generated.
Successful Collection Example
The screenshot shows:

This indicates:
-
Diagnostics were collected successfully.
-
Package creation completed.
-
The package is available for download.
Collection completed successfully
If you have questions about using the Diagnostics feature, please refer to the Diagnostics FAQ for additional guidance and troubleshooting information: FAQs.